standard-setting-study

A standard setting study is a formal, quantitative process for establishing a performance standard on an exam, such as what score is “proficient” or “passing.”  This is typically manifested as a cutscore which is then used for making decisions about people: hire them, pass them, accept them into university, etc.  Because it is used for such important decisions, a lot of work goes into standard setting, using methods based on scientific research.

What is NOT standard setting?

In the assessment world, there are actually three uses of the word standard:

  1. A formal definition of the content that is being tested, such as the Common Core State Standards in the USA.  
  2. A formalized process for delivering exams, as seen in the phrase “standardized testing.”
  3. A benchmark for performance, like we are discussing here.

For this reason, I prefer the term cutscore study, but the phrase standard setting is used more often.  

How is a standard setting study used?

As part of a comprehensive test development cycle, after item authoring, item review, and test form assembly, a cutscore or passing score will often be set to determine what level of performance qualified as “pass” or a similar classification.  This cannot be done arbitrarily, such as setting it at 70% because that’s what you saw when you were in school.  That is a legal landmine!  To be legally defensible and eligible for Accreditation of a Certification Program, it must be done using one of several standard-setting approaches from the psychometric literature.  So, if your organization is classifying examinees into Pass/Fail, Hire/NotHire, Basic/Proficient/Advanced, or any other groups, you most likely need a standard setting study.  This is NOT limited to certification, although it is often discussed in that pass/fail context.

What are some methods of a standard setting study?

There have been many methods suggested in the scientific literature of psychometrics.  They are often delineated into examinee-centered and item-centered approaches.  Angoff and Bookmark are designed around evaluating items, while Contrasting Groups and Borderline Groups are designed around evaluating the distributions of actual examinee scores.  The Bookmark approach is sort of both types, however, because it uses examinee performance on the items as the object of interest.

Angoff

Modified Angoff analysis

In an Angoff study, a panel of subject matter experts rates each item, estimating the percentage of minimally competent candidates that would answer each item correctly.  If we take the average of all raters, this then translates into the average percentage-correct score that the raters expect from a minimally competent candidate – a very compelling argument for a cutscore to pass competent examinees!  It is often done in tandem with the Beuk Compromise.  The Angoff method does not require actual examinee data, though the Beuk does.

Bookmark

The bookmark method orders the items in a test form in ascending difficulty, and a panel of experts reads through and places a “bookmark” in the book where they think a cutscore should be.  Obviously, this requires enough real data to calibrate item difficulty, usually using item response theory, which requires several hundred examinees.

Contrasting Groups

contrasting groups cutscore

With the contrasting groups approach, candidates are sorted into Pass and Fail groups based on their performance on a different exam or some other unrelated standard.  We can then compare the score distributions on our exam for the two separate groups, and pick a cutscore that best differentiates Pass vs Fail on the other standard.  An example of this is below.  If using data from another exam, a sample of at least 50 candidates is obviously needed, since you are evaluating distributions.

Borderline Group

The Borderline Group method is similar to Contrasting Groups, but a borderline group is defined using alternative information such as biodata, and the scores of the group are evaluated.

Hofstee

The Hofstee approach is often used as a reality check for the modified-Angoff method, but can be done on its own.  It involves only a few estimates from a panel of SMEs.

Ebel

The Ebel approach categorizes items by importance as well as difficulty.  It is very old and not used anymore.

How to choose an approach?

There is often no specifically correct answer.  In fact, guidelines like NCCA do not lay out which method to use, they just tell you to use an appropriate method.

There are several considerations.  Perhaps the most important is whether you have existing data.  The Bookmark, Contrasting Groups, and Borderline Group approaches all assume that we have data from a test already delivered, which we can analyze with the perspective of the latent standard.  The Angoff and Hofstee approaches, in contrast, can be done before a test is ever delivered.  This is arguably less defensible, but is a huge practical advantage.

The choice also depends on whether you can easily recruit a panel of subject matter experts, as that is required for Angoff and Bookmark.  The Contrasting Groups method assumes we have a gold standard, which is rare.

How can I implement a standard setting study?

If your organization has an in-house psychometrician, they can usually do this.  If, for example, you are a board of experts in a profession but lack experience in psychometrics, you need to hire a firm.  We can perform such work for you – contact us to learn more.


job analysis

Subject matter experts are an important part of the process in developing a defensible exam.  There are several ways that their input is required.  Here is a list from highest involvement/responsibility to lowest:

  1. Serving on the Certification Committee (if relevant) to decide important things like eligibility pathways
  2. Serving on panels for psychometric steps like Job Task Analysis or Standard Setting (Angoff)
  3. Writing and reviewing the test questions
  4. Answering the survey for the Job Task Analysis

Who are Subject Matter Experts?

A subject matter expert (SME) is someone with knowledge of the exam content.  If you are developing a certification exam for widgetmakers, you need a panel of expert widgetmakers, and sometimes other stakeholders like widget factory managers.

You also need test development staff and psychometricians.  Their job is to guide the process to meet international standards, and make the SME time the most efficient.

Example: Item Writing Workshop

psychometric training and workshopsThe most obvious usage of subject matter experts in exam development is item writing and review. Again, if you are making a certification exam for experienced widgetmakers, then only experienced widgetmakers know enough to write good items.  In some cases, supervisors do as well, but then they are also SMEs.  For example, I once worked on exams for ophthalmic technicians; some of the SMEs were ophthalmic technicians, but some of the SMEs (and much of the nonprofit board) were ophthalmologists, the medical doctors for whom the technicians worked.

An item writing workshop typically starts with training on item writing, including what makes a good item, terminology, and format.  Item writers will then author questions, sometimes alone and sometimes as a group or in pairs.  For higher stakes exams, all items will then be reviewed/edited by other SMEs.

Example: Job Task Analysis

Job Task Analysis studies are a key step in the development of a defensible certification program.  It is the second step in the process, after the initial definition, and sets the stage for everything that comes afterward.  Moreover, if you seek to get your certification accredited by organizations such as NCCA or ANSI, you need to re-perform the job task analysis study periodically. JTAs are sometimes called job analysis, practice analysis, or role delineation studies.

The job task analysis study relies heavily on the experience of Subject Matter Experts (SMEs), just like Cutscore studies. The SMEs have the best tabs on where the profession is evolving and what is most important, which is essential both for the initial JTA and the periodic re-set of the exam. The frequency depends on how quickly your field is evolving, but a cycle of 5 years is often recommended.

The goal of the job task analysis study is to gain quantitative data on the structure of the profession.  Therefore, it typically utilizes a survey approach to gain data from as many professionals as possible.  This starts with a group of SMEs generating an initial list of on-the-job tasks, categorizing them, and then publishing a survey.  The end goal is a formal report with a blueprint of what knowledge, skills, and abilities (KSAs) are required for certification in a given role or field, and therefore what are the specifications of the certification test.

  • Observe— Typically the psychometrician (that’s us) shadows a representative sample of people who perform the job in question (chosen through Panel Composition) to observe and take notes. After the day(s) of observation, the SMEs sit down with the observer so that he or she may ask any clarifying questions.

    The goal is to avoid doing this during the observation so that the observer has an untainted view of the job.  Alternatively, your SMEs can observe job incumbents – which is often the case when the SMEs are supervisors.

  • Generate— The SMEs now have a corpus of information on what is involved with the job, and generate a list of tasks that describe the most important job-related components. Not all job analysis uses tasks, but this is the most common approach in certification testing, hence you will often hear the term job task analysis as a general term.
  • Survey— Now that we have a list of tasks, we send a survey out to a larger group of SMEs and ask them to rate various features of each task.

    How important is the task? How often is it performed? What larger category of tasks does it fall into?

  • Analyze— Next, we crunch the data and quantitatively evaluate the SMEs’ subjective ratings to determine which of the tasks and categories are most important.

  • Review— As a non-SME, the psychometrician needs to take their findings back to the SME panel to review the recommendation and make sure it makes sense.

  • Report— We put together a comprehensive report that outlines what the most important tasks/categories are for the given job.  This in turn serves as the foundation for a test blueprint, because more important content deserves more weight on the test.

    This connection is one of the fundamental links in the validity argument for an assessment.

Example: Cutscore studies

When the JTA is completed, we have to determine who should pass the assessment, and who should fail. This is most often done using the modified Angoff process, where the SMEs conceptualize a minimally competent candidate (MCC) and then set pass/fail point so that the MCC would just barely pass.  There are other methods too, such as Bookmark or Contrasting Groups.

For newly-launching certification programs, these processes go hand-in-hand with item writing and review. The use of evidence-based practices in conducting the job task analysis, test design, writing items, and setting a cutscore serve as the basis for a good certification program.  Moreover, if you are seeking to achieve accreditation – a third part stamp of approval that your credential is high quality – documentation that you completed all these steps is required.

Performing these tasks with a trained psychometrician inherently checks a lot of boxes on the accreditation to-do list, which can position your organization well for the future. When it comes to accreditation— the psychometricians and measurement specialists at Assessment Systems have been around the block a time or two. We can walk you through the lengthy process of becoming accredited, or we can help you perform these tasks a la carte.

Test response function 10 items Angoff

Need to set a cutscore on a test with item response theory?  There are ways to do so directly, such as the Bookmark method.  But do you have an existing cutscore on the number-correct scale?  Cutscores set with classical test theory, such as the Angoff, Nedelsky, or Ebel methods, are easy to implement when the test is scored classically.  But if your test is scored with the item response theory (IRT) paradigm, you need to convert your cutscores onto the theta scale.  The easiest way to do that is to reverse-calculate the test response function (TRF) from IRT.  This post will discuss that.

The Test Response Function

The TRF (sometimes called a test characteristic curve) is an important method of characterizing test performance in the IRT paradigm.  The TRF predicts a classical score from an IRT score, as you see below.  Like the item response function and test information function (item response and test information function ), it uses the theta scale as the X-axis.  The Y-axis can be either the number-correct metric or proportion-correct metric.

Test response function 10 items Angoff

In this example, you can see that a theta of -0.4 translates to an estimated number-correct score of approximately 7.  Note that the number-correct metric only makes sense for linear or LOFT exams, where every examinee receives the same number of items.  In the case of CAT exams, only the proportion correct metric makes sense.

Classical cutscore to IRT

So how does this help us with the conversion of a classical cutscore?  Well, we hereby have a way of translating any number-correct score or proportion-correct score.  So any classical cutscore can be reverse-calculated to a theta value.  If your Angoff study (or Beuk) recommends a cutscore of 7 out of 10 points, you can convert that to a theta cutscore of -0.4 as above.  If the recommended cutscore was 8, the theta cutscore would be approximately 0.7.

Because IRT works in a way that it scores examinees on the same scale with any set of items, as long as those items have been part of a linking/equating study.  Therefore, a single study on a set of items can be equated to any other linear test form, LOFT pool, or CAT pool.  This makes it possible to apply the classically-focused Angoff method to IRT-focused programs.

Have you heard about standard setting approaches such as the Hofstee method, or perhaps the Angoff, Ebel, Nedelsky, or Bookmark methods?  There are certainly various ways to set a defensible cutscore or a professional credentialing or pre-employment test.  Today, we are going to discuss the Hofstee method.

Why Standard Setting?

Certification organizations that care about the quality of their examinations need to follow best practices and international standards for test development, such as the Standards laid out by the National Commission for Certifying Agencies (NCCA).  One component of that is standard setting, also known as cutscore studies.  One of the most common and respected approaches for that is the modified-Angoff methodology.

However, the Angoff approach has one flaw: the subject matter experts (SMEs) tend to expect too much out of minimally competent candidates, and sometimes set a cutscore so high that even they themselves would not pass the exam.  There are several reasons this can occur.  For example, raters might think “I would expect anyone that worked for me to know how to do this” and not consider the fact that people who work for them might have 10 years of experience while test candidates could be fresh out of training/school and have the topic only touched on for 5 minutes.  SMEs often forget what it was like to be a much younger and inexperienced version of themselves.

For this reason, several compromise methods have been suggested to compare the Angoff-recommended cutscore with a “reality check” of actual score performance on the exam, allowing the SMEs to make a more informed decision when setting the official cutscore of the exam.  I like to use the Beuk method and the Hofstee method.

The Hofstee Method

One method of adjusting the cutscore based on raters’ impressions of the difficulty of the test and possible pass rates is the Hofstee method (Mills & Melican, 1987; Cizek, 2006; Burr et al., 2016).  This method requires the raters to estimate four values:

  1. The minimum acceptable failure rate
  2. The maximum acceptable failure rate
  3. The minimum cutscore, even if all examinees failed
  4. The maximum cutscore, even if all examinees passed

The first two values are failure rates, and are therefore between 0% and 100%, with 100% indicating a test that is too difficult for anyone to pass.  The latter two values are on the raw score scale, and therefore range between 0 and the number of items in the test, again with a higher value indicating a more difficult cutscore to achieve.

These values are paired, and the line that passes through the two points estimated.  The intersection of this line with the failure rate function, is the recommendation of the adjusted cutscore.   

hofstee

How can I use the Hofstee Method?

Unlike the Beuk, the Hofstee method does not utilize the Angoff ratings, so it represents a completely independent reality check.  In fact, it is sometimes used as a standalone cutscore setting method itself, but because it does not involve rating of every single item, I recommend it be used in concert with the Angoff and Beuk approaches.


decision-consistency

If you are involved with certification testing and are accredited by the National Commission of Certifying Agencies (NCCA), you have come across the term decision consistency.  NCCA requires you to submit a report of 11 important statistics each year, each for all active test forms.  These 11 provide a high level summary of the psychometric health of each form; more on that report here.  One of the 11 is decision consistency.

What is Decision Consistency?

Decision consistency is an estimate of how consistent the pass/fail decision is on your test.  That is, if someone took your test today, had their brain wiped of that memory, and took the test again next week, what is the probability that they would obtain the same classification both times?  This is often estimated as a proportion or percentage, and we would of course hope that this number is high, but if the test is unreliable it might not be.

The reasoning behind the need for a index specifically on this is that the psychometric aspect we are trying to estimate is different than reliability of point scores (Moltner, Timbil, & Junger, 2015; Downing & Mehrens, 1978).  The argument is that examinees near the cutscore are of interest, and reliability evaluates the entire scale.  It’s for this reason that if you are using item response theory (IRT), the NCCA allows you to instead submit the conditional standard error of measurement function at the cutscore.  But all of the classical decision consistency indices evaluate all examinees, and since most candidates are not near the cutscore, this inflates the baseline.  Only the CSEM – from IRT – follows the line of reasoning of focusing on examinees near the cutscore.

An important distinction that stems from this dichotomy is that of decision consistency vs. accuracy.  Consistency refers to receiving the same pass/fail classification each time if you take the test twice.  But what we really care about is whether your pass/fail based on the test matches with your true state.  For a more advanced treatment on this, I recommend Lathrop (2015).

Indices of Decision Consistency

There are a number of classical methods for estimating an index of decision consistency that have been suggested in the psychometric literature.  A simple and classic approach is Hambleton (1972), which is based on an assumption that examinees actually take the same test twice (or equivalent forms).  Of course, this is rarely feasible in practice, so a number of methods were suggested over the next few years on how to estimate this with a single test administration to a given set of examinees.  These include Huynh (1976), Livingston (1972), and Subkoviak (1976).  These are fairly complex.  I once reviewed a report from a psychometrician that faked the Hambleton index because they didn’t have the skills to figure out any of the indices.

How does decision consistency relate to reliability?

The note I made above about unreliability is worth another visit, however.  After the rash of publications on the topic, Mellenbergh and van der Linden (1978; 1980) pointed out that if you assume a linear loss function for misclassification, the conventional estimate of reliability – coefficient alpha – serves as a solid estimate of decision consistency.  What is a linear loss function?  It means that a misclassification is worse if the person’s score is further from the cutscore.  That is, of the cutscore is 70, failing someone with a true score of 80 is twice as bad as failing someone with a true score of 75.  Of course, we never know someone’s true score, so this is a theoretical assumption, but the researchers make an excellent point.

But while research amongst psychometricians on the topic cooled since they made that point, NCCA still requires one of the statistics -most from the 1970s – to be reported.  The only other well-known index on the topic was Hanson and Brennan (1990).  While the indices have been show to be different than classical reliability, I remain to be convinced that they are the right approach.  Of course, I’m not much of a fan of classical test theory at all in the first place; that acceptance of CSEM from IRT is definitely aligned with my views on how psychometrics should tackle measurement problems.

Item banking refers to the purposeful creation of a database of assessment items to serve as a central repository of all test content, improving efficiency and quality. The term item refers to what many call questions; though their content need not be restricted as such and can include problems to solve or situations to evaluate in addition to straightforward questions. As a critical foundation to the test development cycle, item banking is the foundation for the development of valid, reliable content and defensible test forms.

Automated item banking systems, such as Assess.ai or FastTest, result in significantly reduced administrative time for developing/reviewing items and assembling/publishing tests, while producing exams that have greater reliability and validity.  Contact us to request a free account.


What is Item Banking?

While there are no absolute standards in creating and managing item banks, best practice guidelines are emerging. Here are the essentials your should be looking for:

   Items are reusable objects; when selecting an item banking platform it is important to ensure that items can be used more than once; ideally, item performance should be tracked not only within a test form but across test forms as well.

   Item history and usage are tracked; the usage of a given item, whether it is actively on a test form or dormant waiting to be assigned, should be easily accessible for test developers to assess, as the over-exposure of items can reduce the validity of a test form. As you deliver your items, their content is exposed to examinees. Upon exposure to many examinees, items can then be flagged for retirement or revision to reduce cheating or teaching to the test.

   Items can be sorted; as test developers select items for a test form, it is imperative that they can sort items based on their content area or other categorization methods, so as to select a sample of items that is representative of the full breadth of constructs we intend to measure.

   Item versions are tracked; as items appear on test forms, their content may be revised for clarity. Any such changes should be tracked and versions of the same item should have some link between them so that we can easily review the performance of earlier versions in conjunction with current versions.

   Review process workflow is tracked; as items are revised and versioned, it is imperative that the changes in content and the users who made these changes are tracked. In post-test assessment, there may be a need for further clarification, and the ability to pinpoint who took part in reviewing an item and expedite that process.

   Metadata is recorded; any relevant information about an item should be recorded and stored with the item. The most common applications for metadata that we see are author, source, description, content area, depth of knowledge, IRT parameters, and CTT statistics, but there are likely many data points specific to your organization that is worth storing.

Managing an Item Bank

Names are important. As you create or import your item banks it is important to identify each item with a unique, but recognizable name. Naming conventions should reflect your bank’s structure and should include numbers with leading zeros to support true numerical sorting.  You might want to also add additional pieces of information.  If importing, the system should be smart enough to recognize duplicates.

Search and filter. The system should also have a reliable sorting mechanism. 

automated item generation cpr

Prepare for the Future: Store Extensive Metadata

Metadata is valuable. As you create items, take the time to record simple metadata like author and source. Having this information can prove very useful once the original item writer has moved to another department, or left the organization. Later in your test development life cycle, as you deliver items, you have the ability to aggregate and record item statistics. Values like discrimination and difficulty are fundamental to creating better tests, driving reliability, and validity.

Statistics are used in the assembly of test forms while classical statistics can be used to estimate mean, standard deviation, reliability, standard error, and pass rate. 

Item banking statistics

Item response theory parameters can come in handy when calculating test information and standard error functions. Data from both psychometric theories can be used to pre-equate multiple forms.

In the event that your organization decides to publish an adaptive test, utilizing CAT delivery, item parameters for each item will be essential. This is because they are used for intelligent selection of items and scoring examinees. Additionally, in the event that the integrity of your test or scoring mechanism is ever challenged, documentation of validity is essential to defensibility and the storage of metadata is one such vital piece of documentation.

Increase Content Quality: Track Workflow

Utilize a review workflow to increase quality. Using a standardized review process will ensure that all items are vetted in a similar matter. Have a step in the process for grammar, spelling, and syntax review, as well as content review by a subject matter expert. As an item progresses through the workflow, its development should be tracked, as workflow results also serve as validity documentation.

Accept comments and suggestions from a variety of sources. It is not uncommon for each item reviewer to view an item through their distinctive lens. Having a diverse group of item reviewers stands to benefit your test-takers, as they are likely to be diverse as well!

item review kanban

Keep Your Items Organized: Categorize Them

Identify items by content area. Creating a content hierarchy can also help you to organize your item bank and ensure that your test covers the relevant topics. Most often, we see content areas defined first by an analysis of the construct(s) being tested. In the event of a high school science test, this may include the evaluation of the content taught in class. A high-stakes certification exam, almost always includes a job-task analysis. Both methods produce what is called a test blueprint, indicating how important various content areas are to the demonstration of knowledge in the areas being assessed.

Once content areas are defined, we can assign items to levels or categories based on their content. As you are developing your test, and invariably referring back to your test blueprint, you can use this categorization to determine which items from each content area to select.

Why Item Banking?

There is no doubt that item banking is a key aspect of developing and maintaining quality assessments. Utilizing best practices, and caring for your items throughout the test development life cycle, will pay great dividends as it increases the reliability, validity, and defensibility of your assessment. Moreover, good item banking will make the job easier and more efficient thus reducing the cost of item development and test publishing.

Ready to improve assessment quality through item banking?

Visit our Contact Us page, where you can request a demonstration or a free account (up to 500 items).

modified-Angoff Beuk compromise

A modified-Angoff method study is one of the most common ways to set a defensible cutscore on an exam.  It therefore means that the pass/fail decisions made by the test are more trustworthy than if you picked a random number; if your doctor, lawyer, accountant, or other professional has passed an exam where the cutscore has been set with this method, you can place more trust in their skills.

What is the Angoff method?

It is a scientific way of setting a cutscore (pass point) on a test.  If you have a criterion-referenced interpretation, it is not legally defensible to just conveniently pick a round number like 70%; you need a formal process.  There are a number of acceptable methodologies in the psychometric literature for standard-setting studies, also known as cutscores or passing points.  Some examples include Angoff, modified-Angoff, Bookmark, Contrasting Groups, and Borderline.  The modified-Angoff approach is by far the popular approach.  It is used especially frequently for certification, licensure, certificate, and other credentialing exams. 

It was originally suggested as a mere footnote by renowned researcher William Angoff, at Educational Testing Service.

How does the Angoff approach work?

First, you gather a group of subject matter experts, and have them define what they consider to be a Minimally Competent Candidate (MCC).  Next, you have them estimate the percent of minimally competent candidates that will answer each item correctly.  You then analyze the results for outliers or inconsistencies, and have the experts discuss then re-rate the items to gain better consensus.  The average final rating is then the expected percent-correct score for a minimally competent candidate.

Advantages of the Angoff method

  1. It is defensible.  Because it is the most commonly used approach and is widely studied in the scientific literature, it is well-accepted.
  2. You can implement it before a test is ever delivered.  Some other methods require you to deliver the test to a large sample first.
  3. It is conceptually simple, easy enough to explain to non-psychometricians.
  4. It incorporates the judgment of a panel of experts, not just one person or a round number.
  5. It works for tests with both classical test theory and item response theory.
  6. It does not take long to implement – if a short test, it can be done in a matter of hours!
  7. It can be used with different item types, including polytomously scored items (multi-points).

Disadvantages of the Angoff method

  1. It does not use actual data, unless you implement the Beuk method alongside.  
  2. It can lead to the experts overestimating the performance of entry-level candidates, as they forgot what it was like to start out 20-30 years ago.

FAQ about the Angoff approach

How do I calculate the Angoff cutscore and inter-rater reliability?

What is the difference between Angoff and modified-Angoff?

The original approach had the experts only say whether they thought an MCC would get it right, not the percentage.

Why do I need to do an Angoff study?

If the test is used to make decisions, like hiring or certification, you are not allowed to pick a round number like 70% with no justification.

What if the experts disagree?

You will need to evaluate inter-rater reliability and agreement, then re-rate the items. More info below.

How many experts do I need?

The bare minimum is 6; 8-10 is better.

Do I need to deliver the test first?

No, that is one advantage of this method - you can set a cutscore before you deliver to any examinees.


Example of the Modified-Angoff Method

First of all, do not expect a straightforward, easy process that leads to an unassailably correct cutscore.  All standard-setting methods involve some degree of subjectivity.  The goal of the methods is to reduce that subjectivity as much as possible.  Some methods focus on content, others on examinee performance data, while some try to meld the two.

Step 1: Prepare Your Team

The modified-Angoff process depends on a representative sample of subject matter experts (SMEs), usually 6-20. By “representative” I mean they should represent the various stakeholders. For instance, a certification for medical assistants might include experienced medical assistants, nurses, and physicians, from different areas of the country. You must train them about their role and how the process works, so they can understand the end goal and drive toward it.

Step 2: Define The Minimally Competent Candidate (MCC)

This concept is the core of the modified-Angoff method, though it is known by a range of terms or acronyms, including minimally qualified candidates (MQC) or just barely qualified (JBQ).  The reasoning is that we want our exam to separate candidates that are qualified from those that are not.  So we ask the SMEs to define what makes someone qualified (or unqualified!) from a perspective of skills and knowledge. This leads to a conceptual definition of an MCC. We then want to estimate what score this borderline candidate would achieve, which is the goal of the remainder of the study. This step can be conducted in person, or via webinar.

Step 3: Round 1 Ratings

Next, ask your SMEs to read through all the items on your test form and estimate the percentage of MCCs that would answer each correctly.  A rating of 100 means the item is a slam dunk; it is so easy that every MCC would get it right.  A rating of 40 is very difficult.  Most ratings are in the 60-90 range if the items are well-developed. The ratings should be gathered independently; if everyone is in the same room, let them work on their own in silence. This can easily be conducted remotely, though.

Step 4: Discussion

This is where it gets fun.  Identify items where there is the most disagreement (as defined by grouped frequency distributions or standard deviation) and make the SMEs discuss it.  Maybe two SMEs thought it was super easy and gave it a 95 and two other SMEs thought it was super hard and gave it a 45.  They will try to convince the other side of their folly. Chances are that there will be no shortage of opinions and you, as the facilitator, will find your greatest challenge is keeping the meeting on track. This step can be conducted in person, or via webinar.

Step 5: Round 2 Ratings

Raters then re-rate the items based on the discussion.  The goal is that there will be a greater consensus.  In the previous example, it’s not likely that every rater will settle on a 70.  But if your raters all end up from 60-80, that’s OK. How do you know there is enough consensus?  We recommend the inter-rater reliability suggested by Shrout and Fleiss (1979), as well as looking at inter-rater agreement and dispersion of ratings for each item. This use of multiple rounds is known as the Delphi approach; it pertains to all consensus-driven discussions in any field, not just psychometrics.

Step 6: Evaluate Results and Final Recommendation

Evaluate the results from Round 2 as well as Round 1.  An example of this is below.  What is the recommended cutscore, which is the average or sum of the Angoff ratings depending on the scale you prefer?  Did the reliability improve?  Estimate the mean and SD of examinee scores (there are several methods for this). What sort of pass rate do you expect?  Even better, utilize the Beuk Compromise as a “reality check” between the modified-Angoff approach and actual test data.  You should take multiple points of view into account, and the SMEs need to vote on a final recommendation. They, of course, know the material and the candidates so they have the final say.  This means that standard setting is a political process; again, reduce that effect as much as you can.

Some organizations do not set the cutscore at the recommended point, but at one standard error of judgment (SEJ) below the recommended point.  The SEJ is based on the inter-rater reliability; note that it is NOT the standard error of the mean or the standard error of measurement.  Some organizations use the latter; the former is just plain wrong (though I have seen it used by amateurs).


modified angoff

Step 7: Write Up Your Report

Validity refers to evidence gathered to support test score interpretations.  Well, you have lots of relevant evidence here. Document it.  If your test gets challenged, you’ll have all this in place.  On the other hand, if you just picked 70% as your cutscore because it was a nice round number, you could be in trouble.

Additional Topics

In some situations, there are more issues to worry about.  Multiple forms?  You’ll need to equate in some way.  Using item response theory?  You’ll have to convert the cutscore from the modified-Angoff method onto the theta metric using the Test Response Function (TRF).  New credential and no data available? That’s a real chicken-and-egg problem there.

Where Do I Go From Here?

Ready to take the next step and actually apply the modified-Angoff process to improving your exams?  Sign up for a free account in our  FastTest item banker.  

References

Shrout, P. E., & Fleiss, J. L. (1979). Intraclass correlations: uses in assessing rater reliability. Psychological bulletin86(2), 420.

test-scaling

I often hear this question about scaling, especially regarding the scaled scoring functionality found in software like FastTest and Xcalibre.  The following is adapted from lecture notes I wrote while teaching a course in Measurement and Assessment at the University of Cincinnati.

Test Scaling: Sort of a Tale of Two Cities

Scaling at the test level really has two meanings in psychometrics. First, it involves defining the method to operationally scoring the test, establishing an underlying scale on which people are being measured.  It also refers to score conversions used for reporting scores, especially conversions that are designed to carry specific information.  The latter is typically called scaled scoring.

You have all been exposed to this type of scaling, though you might not have realized it at the time. Most high-stakes tests like the ACT, SAT, GRE, and MCAT are reported on scales that are selected to convey certain information, with the actual numbers selected more or less arbitrarily. The SAT and GRE have historically had a nominal mean of 500 and a standard deviation of 100, while the ACT has a nominal mean of 18 and standard deviation of 6. These are actually the same scale, because they are nothing more than a converted z-score (standard or zed score), simply because no examinee wants to receive a score report that says you got a score of -1. The numbers above were arbitrarily selected, and then the score range bounds were selected based on the fact that 99% of the population is within plus or minus three standard deviations. Hence, the SAT and GRE range from 200 to 800 and the ACT ranges from 0 to 36. This leads to the urban legend of receiving 200 points for writing your name correctly on the SAT; again, it feels better for the examinee. A score of 300 might seem like a big number and 100 points above the minimum, but it just means that someone is in the 3rd percentile.

Now, notice that I said “nominal.” I said that because the tests do not actually have those means observed in samples, because the samples have substantial range restriction. Because these tests are only taken by students serious about proceeding to the next level of education, the actual sample is of higher ability than the population. The lower third or so of high school students usually do not bother with the SAT or ACT. So many states will have an observed average ACT of 21 and standard deviation of 4. This is an important issue to consider in developing any test. Consider just how restricted the population of medical school students is; it is a very select group.

How can I select a score scale?

score-scale

For various reasons, actual observed scores from tests are often not reported, and only converted scores are reported.  If there are multiple forms which are being equated, scaling will hide the fact that the forms differ in difficulty, and in many cases, differ in cutscore.  Scaled scores can facilitate feedback.  They can also help the organization avoid explanations of IRT scoring, which can be a headache to some.

When deciding on the conversion calculations, there are several important questions to consider.

First, do we want to be able to make fine distinctions among examinees? If so, the range should be sufficiently wide. My personal view is that the scale should be at least as wide as the number of items; otherwise you are voluntarily giving up information. This in turn means you are giving up variance, which makes it more difficult to correlate your scaled scores with other variables, like the MCAT is correlated with success in medical school. This, of course, means that you are hampering future research – unless that research is able to revert back to actual observed scores to make sure all information possible is used. For example, supposed a test with 100 items is reported on a 5-point grade scale of A-B-C-D-F. That scale is quite restricted, and therefore difficult to correlate with other variables in research. But you have the option of reporting the grades to students and still using the original scores (0 to 100) for your research.

Along the same lines, we can swing completely in the other direction. For many tests, the purpose of the test is not to make fine distinctions, but only to broadly categorize examinees. The most common example of this is a mastery test, where the examinee is being assessed on their mastery of a certain subject, and the only possible scores are pass and fail. Licensure and certification examinations are an example. An extension of this is the “proficiency categories” used in K-12 testing, where students are classified into four groups: Below Basic, Basic, Proficient, and Advanced. This is used in the National Assessment of Educational Progress. Again, we see the care taken for reporting of low scores; instead of receiving a classification like “nonmastery” or “fail,” the failures are given the more palatable “Below Basic.”

Another issue to consider, which is very important in some settings but irrelevant in others, is vertical scaling. This refers to the chaining of scales across various tests that are at quite different levels. In education, this might involve linking the scales of exams in 8th grade, 10th grade, and 12th grade (graduation), so that student progress can be accurately tracked over time. Obviously, this is of great use in educational research, such as the medical school process. But for a test to award a certification in a medical specialty, it is not relevant because it is really a one-time deal.

Lastly, there are three calculation options: pure linear (ScaledScore = RawScore * Slope + Intercept), standardized conversion (Old Mean/SD to New Mean/SD), and nonlinear approaches like Equipercentile.

Perhaps the most important issue is whether the scores from the test will be criterion-referenced or norm-referenced. Often, this choice will be made for you because it distinctly represents the purpose of your tests. However, it is quite important and usually misunderstood, so I will discuss this in detail.

Criterion-Referenced vs. Norm-Referenced

data-analysis-norms

This is a distinction between the ways test scores are used or interpreted. A criterion-referenced score interpretation means that the score is interpreted with regards to defined content, blueprint, or curriculum (the criterion), and ignores how other examinees perform (Bond, 1996). A classroom assessment is the most common example; students are scored on the percent of items correct, which is taken to imply the percent of the content they have mastered. Conversely, a norm-referenced score interpretation is one where the score provides information about the examinee’s standing in the population, but no absolute (or ostensibly absolute) information regarding their mastery of content. This is often the case with non-educational measurements like personality or psychopathology. There is no defined content which we can use as a basis for some sort of absolute interpretation. Instead, scores are often either z-scores or some linear function of z-scores.  IQ is historically scaled with a mean of 100 and standard deviation of 15.

It is important to note that this dichotomy is not a characteristic of the test, but of the test score interpretations. This fact is more apparent when you consider that a single test or test score can have several interpretations, some of which are criterion-referenced and some of which are norm-referenced. We will discuss this deeper when we reach the topic of validity, but consider the following example. A high school graduation exam is designed to be a comprehensive summative assessment of a secondary education. It is therefore specifically designed to cover the curriculum used in schools, and scores are interpreted within that criterion-referenced context. Yet scores from this test could also be used for making acceptance decisions at universities, where scores are only interpreted with respect to their percentile (e.g., accept the top 40%). The scores might even do a fairly decent job at this norm-referenced application. However, this is not what they are designed for, and such score interpretations should be made with caution.

Another important note is the definition of “criterion.” Because most tests with criterion-referenced scores are educational and involve a cutscore, a common misunderstanding is that the cutscore is the criterion. It is still the underlying content or curriculum that is the criterion, because we can have this type of score interpretation without a cutscore. Regardless of whether there is a cutscore for pass/fail, a score on a classroom assessment is still interpreted with regards to mastery of the content.  To further add to the confusion, Industrial/Organizational psychology refers to outcome variables as the criterion; for a pre-employment test, the criterion is typically Job Performance at a later time.

This dichotomy also leads to some interesting thoughts about the nature of your construct. If you have a criterion-referenced score, you are assuming that the construct is concrete enough that anybody can make interpretations regarding it, such as mastering a certain percentage of content. This is why non-concrete constructs like personality tend to be only norm-referenced. There is no agreed-upon blueprint of personality.

Multidimensional Scaling

camera lenses for multidimensional item response theory

An advanced topic worth mentioning is multidimensional scaling (see Davison, 1998). The purpose of multidimensional scaling is similar to factor analysis (a later discussion!) in that it is designed to evaluate the underlying structure of constructs and how they are represented in items. This is therefore useful if you are working with constructs that are brand new, so that little is known about them, and you think they might be multidimensional. This is a pretty small percentage of the tests out there in the world; I encountered the topic in my first year of graduate school – only because I was in a Psychological Scaling course – and have not encountered it since.

Summary of test scaling

Scaling is the process of defining the scale that on which your measurements will take place. It raises fundamental questions about the nature of the construct. Fortunately, in many cases we are dealing with a simple construct that has a well-defined content, like an anatomy course for first-year medical students. Because it is so well-defined, we often take criterion-referenced score interpretations at face value. But as constructs become more complex, like job performance of a first-year resident, it becomes harder to define the scale, and we start to deal more in relatives than absolutes. At the other end of the spectrum are completely ephemeral constructs where researchers still can’t agree on the nature of the construct and we are pretty much limited to z-scores. Intelligence is a good example of this.

Some sources attempt to delineate the scaling of people and items or stimuli as separate things, but this is really impossible as they are so confounded. Especially since people define item statistics (the percent of people that get an item correct) and items define people scores (the percent of items a person gets correct). It is for this reason that IRT, the most advanced paradigm in measurement theory, was designed to place items and people on the same scale. It is also for this reason that item writing should consider how they are going to be scored and therefore lead to person scores. But because we start writing items long before the test is administered, and the nature of the construct is caught up in the scale, the issues presented here need to be addressed at the very beginning of the test development cycle.

SIFT test security data forensics

Test fraud is an extremely common occurrence.  We’ve all seen articles about examinee cheating.  However, there are very few defensible tools to help detect it.  I once saw a webinar from an online testing provider that proudly touted their reports on test security… but it turned out that all they provided was a simple export of student answers that you could subjectively read and form conjectures.  The goal of SIFT is to provide a tool that implements real statistical indices from the corpus of scientific research on statistical detection of test fraud, yet is user-friendly enough to be used by someone without a PhD in psychometrics and experience in data forensics.  SIFT still provides more collusion indices and other analysis than any other software on the planet, making it the standard in the industry from the day of its release.  The science behind SIFT is also being implemented in our world-class online testing platform, FastTest.  It is also worth noting that FastTest supports computerized adaptive testing, which is known to increase test security.

Interested?  Download a free trial version of SIFT!

What is Test Fraud?

As long as tests have been around, people have been trying to cheat them.  This is only natural; anytime there is a system with some sort of stakes/incentive involved (and maybe even when not), people will try to game that system.  Note that the root culprit is the system itself, not the test. Blaming the test is just shooting the messenger.  However, in most cases, the system serves a useful purpose.  In the realm of assessment, that means that K12 assessments provide useful information on curriculum on teachers, certification tests identify qualified professionals, and so on.  In such cases, we must minimize the amount of test fraud in order to preserve the integrity of the system.

When it comes to test fraud, the old cliche is true: an ounce of prevention is worth a pound of cure. You’ll undoubtedly see that phrase at conferences and in other resources.  So I of course recommend that your organization implement reasonable preventative measures to deter test fraud.  Nevertheless, there will still always be some cases.  SIFT is intended to help find those.  Also, some examinees might also be deterred by the knowledge that such analysis is even being done.

How can SIFT help me with statistical detection of test fraud?

Like other psychometric software, SIFT does not interpret results for you.  For example, software for item analysis like  Iteman  and  Xcalibre  do not specifically tell you which items to retire or revise, or how to revise them.  But they provide the output necessary for a practitioner to do so.  SIFT provides you a wide range of output that can help you find different types of test fraud, like copying, proctor help, suspect test centers, brain dump usage, etc.  It can also help find other issues, like low examinee motivation.  But YOU have to decide what is important to you regarding statistical detection of test fraud, and look for relevant evidence.  More information on this is provided in the manual, but here is a glimpse.

SIFT test security data forensics

First, there are a number if indices you can evaluate, as you see above.  SIFT  will calculate those collusion indices for each pair of students, and summarize the number of flags.

sift collusion index analysis

A certification organization could use  SIFT  to look for evidence of brain dump makers and takers by evaluating similarity between examinee response vectors and answers from a brain dump site – especially if those were intentionally seeded by the organization!  We also might want to find adjacent examinees or examinees in the same location that group together in the collusion index output.  Unfortunately, these indices can differ substantially in their conclusions.

Additionally, you might want to evaluate time data.  SIFT  provides this as well.

sift time analysis

Finally, we can roll up many of these statistics to the group level.  Below is an example that provides a portion of  SIFT  output regarding teachers.  Note the Gutierrez has suspiciously high scores but without spending much more time.  Cheating?  Possibly.  On the other hand, that is the smallest N, so perhaps the teacher just had a group of accelerated students.  Worthington, on the other hand, also had high scores but had notably shorter times – perhaps the teacher was helping?

sift group analysis


The Story of SIFT

I started  SIFT  in 2012.  Years ago, ASC sold a software program called  Scrutiny!  We had to stop selling it because it did not work on recent versions of Windows, but we still received inquiries for it.  So I set out to develop a program that could perform the analysis from  Scrutiny! (the Bellezza & Bellezza index) but also much more.  I quickly finished a few collusion indices.  Then unfortunately I had to spend a few years dealing with the realities of business, wasting hundreds of hours in pointless meetings and other pitfalls.  I finally set a goal to release SIFT in July 2016.

Version 1.0 of  SIFT  includes 10 collusion indices (5 probabilistic, 5 descriptive), response time analysis, group level analysis, and much more to aid in the statistical detection of test fraud.  This is obviously not an exhaustive list of the analyses from the literature, but still far surpasses other options for the practitioner, including the choice to write all your own code.  Suggestions?  I’d love to hear them.

assessment-technology-improve-exams

Assessment is being drastically impacted by technology, as is much of education.  Just like learning is undergoing a sea-change with artificial intelligence, multimedia, gamification, and many more aspects, assessment is likewise being impacted.  This post discussed a few ways this is happening.

What is assessment technology?


10 Ways That Assessment Technology Can Improve Exams

Automated Item generation

Newer assessment platforms will include functionality for automated item generation.  There are two types: template-based and AI text generators from LLMs like ChatGPT.

Gamification

Low-stakes assessment like formative quizzes in eLearning platforms are ripe for this.  Students can earn points, not just in a sense of test scores, but perhaps something like earning coins in a video game, and gaining levels.  They might even have an avatar that can be equipped with cool gear that the student can win.

Simulations

psychometric training and workshopsIf you want to assess how somebody performs a task, it used to be that you had to fly them in.  For example, I used to work on ophthalmic exams where they would fly candidates into a clinic once a year, to do certain tasks while physicians were watching and grading.  Now, many professions offer simulations of performance tests.

Workflow management

Items are the basic building blocks of the assessment.  If they are not high quality, everything else is a moot point. There needs to be formal processes in place to develop and review test questions.  You should be using item banking software that helps you manage this process.

Linking

Linking and equating refer to the process of statistically determining comparable scores on different forms of an exam, including tracking a scale across years and completely different set of items.  If you have multiple test forms or track performance across time, you need this.  And IRT provides far superior methodologies.

Automated test assembly

The assembly of test forms – selecting items to match blueprints – can be incredibly laborious.  That’s why we have algorithms to do it for you.  Check out  TestAssembler.

Item/Distractor analysis

Iteman45-quantile-plot
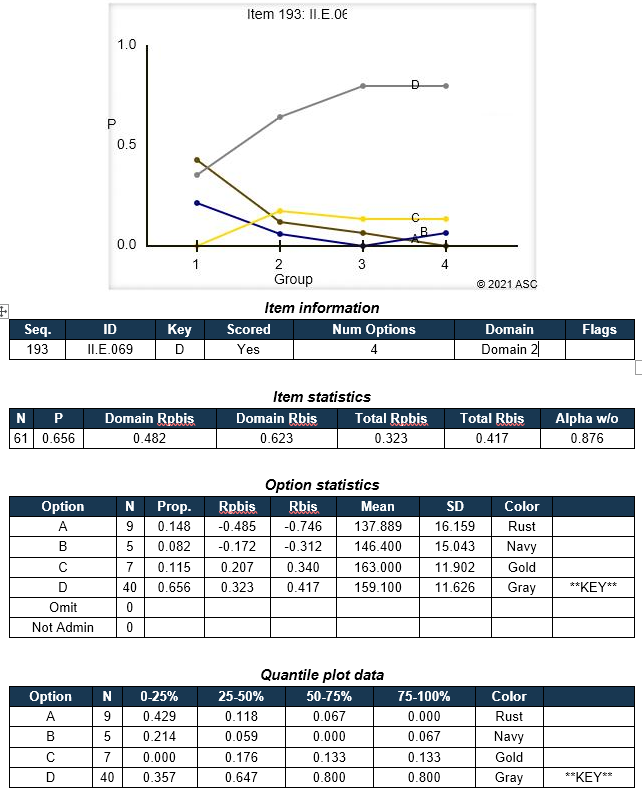
If you are using items with selected responses (including multiple choice, multiple response, and Likert), a distractor/option analysis is essential to determine if those basic building blocks are indeed up to snuff.  Our reporting platform in  FastTest, as well as software like  Iteman  and  Xcalibre, is designed for this purpose.

Item response theory (IRT)

This is the modern paradigm for developing large-scale assessments.  Most important exams in the world over the past 40 years have used it, across all areas of assessment: licensure, certification, K12 education, postsecondary education, language, medicine, psychology, pre-employment… the trend is clear.  For good reason.  It will improve assessment.

Automated essay scoring

This technology is has become more widely available to improve assessment.  If your organization scores large volumes of essays, you should probably consider this.  Learn more about it here.  There was a Kaggle competition on it in the past.

Computerized adaptive testing (CAT)

Tests should be smart.  CAT makes them so.  Why waste vast amounts of examinee time on items that don’t contribute to a reliable score, and just discourage the examinees?  There are many other advantages too.