Posts on psychometrics: The Science of Assessment

split-half-reliability-analysis

Split Half Reliability is an internal consistency approach to quantifying the reliability of a test, in the paradigm of classical test theoryReliability refers to the repeatability or consistency of the test scores; we definitely want a test to be reliable.  The name comes from a simple description of the method: we split the test into two halves, calculate the score on each half for each examinee, then correlate those two columns of numbers.  If the two halves measure the same thing, then the correlation is high, indicating a decent level of unidimensionality in the construct and reliability in measuring the construct.

Why do we need to estimate reliability?  Well, it is one of the easiest ways to quantify the quality of the test.  Some would argue, in fact, that it is a gross oversimplification.  However, because it is so convenient, classical indices of reliability are incredibly popular.  The most popular is coefficient alpha, which is a competitor to split half reliability.

How to Calculate Split Half Reliability

The process is simple.

  1. Take the test and split it in half
  2. Calculate the score of each examinee on each half
  3. Correlate the scores on the two halves

The correlation is best done with the standard Pearson correlation.

Pearson-correlation-formula

This, of course, begs the question:  How do we split the test into two halves?  There are so many ways.  Well, psychometricians generally recommend three ways:

  1. First half vs last half
  2. Odd-numbered items vs even-numbered items
  3. Random split

You can do these manually with your matrix of data, but good psychometric software will for these for you, and more (see screenshot below).

Example

Suppose this is our data set, and we want to calculate split half reliability.

Person Item1 Item2 Item3 Item4 Item5 Item6 Score
1 1 0 0 0 0 0 1
2 1 0 1 0 0 0 2
3 1 1 0 1 0 0 3
4 1 0 1 1 1 1 5
5 1 1 0 1 0 1 4

Let’s split it by first half and last half.  Here are the scores.

Score 1 Score 2
1 0
2 0
2 1
2 3
2 2

The correlation of these is 0.51.

Now, let’s try odd/even.

Score 1 Score 2
1 0
2 0
1 2
3 2
1 3

The correlation of these is -0.04!  Obviously, the different ways of splitting don’t always agree.  Of course, with such a small sample here, we’d expect a wide variation.

Advantages of Split Half Reliability

One advantage is that it is so simple, both conceptually and computationally.  It’s easy enough that you can calculate it in Excel if you need to.  This also makes it easy to interpret and understand.

Another advantage, which I was taught in grad school, is that split half reliability assumes equivalence of the two halves that you have created; on the other hand, coefficient alpha is based at an item level and assumes equivalence of items.  This of course is never the case – but alpha is fairly robust and everyone uses it anyway.

Disadvantages… and the Spearman-Brown Formula

The major disadvantage is that this approach is evaluating half a test.  Because tests are more reliable with more items, having fewer items in a measure will reduce its reliability.  So if we take a 100 item test and divide it into two 50-item halves, then we are essentially making a quantification of reliability for a 50 item test.  This means we are underestimating the reliability of the 100 item test.  Fortunately, there is a way to adjust for this.  It is called the Spearman-Brown Formula.  This simple formula adjusts the correlation back up to what it should be for a 100 item test.

Another disadvantage was mentioned above: the different ways of splitting don’t always agree.  Again, fortunately, if you have a larger sample of people or a longer test, the variation is minimal.

OK, how do I actually implement?

Any good psychometric software will provide some estimates of split half reliability.  Below is the table of reliability analysis from Iteman.  This table actually continues for all subscores on the test as well.  You can download Iteman for free at its page and try it yourself.

This test had 100 items and 85 scored items (15 unscored pilot).  The alpha was around 0.82, which is acceptable, though it should be higher for 100 items.  The results then show for all three split half methods, and then again for the Spearman-Brown (S-B) adjusted version of each.  Do they agree with alpha?  For the total test, the results don’t jive for two of the three methods.  But for the Scored Items, the three S-B calculations align with the alpha value.  This is most likely because some of the 15 pilot items were actually quite bad.  In fact, note that the alpha for 85 items is higher than for 100 items – which says the 15 new items were actually hurting the test!

Reliability analysis Iteman

This is a good example of using alpha and split half reliability together.  We made an important conclusion about the exam and its items, merely by looking at this table.  Next, the researcher should evaluate those items, usually with P value difficulty and point-biserial discrimination.


Nedelsky-method-standard-setting-panel-meeting

The Nedelsky method is an approach to setting the cutscore of an exam.  Originally suggested by Nedelsky (1954), it is an early attempt to implement a quantitative, rigorous procedure to the process of standard setting.  Quantitative approaches are needed to eliminate the arbitrariness and subjectivity that would otherwise dominate the process of setting a cutscore.  The most obvious and common example of this is simply setting the cutscore at a round number like 70%, regardless of the difficulty of the test or the ability level of the examinees.  It is for this reason that a cutscore must be set with a method such as the Nedelsky approach to be legally defensible or meet accreditation standards.

How to implement the Nedelsky method

The first step, like several other standard setting methods, is to gather a panel of subject matter experts (SMEs).  The next step is for the panel to discuss the concept of a minimally qualified candidate   This is a concept about the type of candidate that should barely pass this exam, and sits on the borderline of competence. They then review a test form, paying specific attention to each of the items on the form.  For every item in the test form, each rater estimates the number of options that an MCC will be able to eliminate.  This then translates into the probability of a correct response, assuming that each candidate guesses amongst the remaining options.   If an MCC can only eliminate one of the options of a four option item, they then have a 1/3 = 33% chance of getting the item correct.  If two, then ½ = 50%.

These ratings are then averaged across all items and all raters.  This then represents the percentage score expected of an MCC on this test form, as defined by the panel.  This makes a compelling, quantitative argument for what the cutscore should then be, because we would expect anyone that is minimally qualified to score at that point or higher.

Item Rater1 Rater2 Rater3
1 33 50 33
2 25 25 25
3 25 33 25
4 33 50 50
5 50 100 50
Total 33.2 51.6 36.6

Drawbacks to the Nedelsky method

This approach only works on multiple choice items, because it depends on the evaluation of option probability.  It is also a gross oversimplification.  If the item has four options, there are only four possible values for the Nedelsky rating 25%, 33%, 50%, 100%.  This is all the more striking when you consider that most items tend to have a percent-correct value between 50% and 100%, and reflecting this fact is impossible with the Nedelsky method. Obviously, more goes into answering a question than simply eliminating one or two of the distractors.  This is one reason that another method is generally preferred and supersedes this method…

Nedelsky vs Modified-Angoff

The Nedelsky method has been superseded by the modified-Angoff method.  The modified-Angoff method is essentially the same process but allows for finer variations, and can be applied to other item types.  The modified-Angoff method subsumes the Nedelsky method, as a rater can still implement the Nedelsky approach within that paradigm.  In fact, I often tell raters to use the Nedelsky approach as a starting point or benchmark.  For example, if they think that the examinee can easily eliminate two options, and is slightly more likely to guess one of the remaining two options, the rating is not 50%, but rather 60%.  The modified-Angoff approach also allows for a second round of ratings after discussion to increase consensus (Delphi Method).  Raters can slightly adjust their rating without being hemmed into one of only four possible ratings.

Enemy items lego

Enemy items is a psychometric term that refers to two test questions (items) which should not be on the same test form (if linear) seen by a given examinee (if LOFT or adaptive).  This can therefore be relevant to linear forms, but also pertains to linear on the fly testing (LOFT) and computerized adaptive testing (CAT).  There are several reasons why two items might be considered enemies:

  1. Too similar: the text of the two items is almost the same
  2. One gives away the answer to the other
  3. The items are on the same topic/answer, even if the text is different.


How do we find enemy items?

There are two ways (as there often is): Manual and Automated.fasttest-item-authoring

Manual means that humans are reading items and intentionally mark two of them as enemies.  So maybe you have a reviewer that is reviewing new items from a pool of 5 authors, and finds two that cover the same concept.  They would mark them as enemies.

Automated means that you have a machine learning algorithm, such as one which uses natural language processing (NLP) to evaluate all items in a pool and then uses distance/similarity metrics to quantify how similar they are.  Of course, this could miss some of the situations, like if two items have the same topic but have fairly different text.  It is also difficult to do if items have formulas, multimedia files, or other aspects that could not be caught by NLP.


Why are enemy items a problem?

This violates the assumption of local independence; that the interaction of an examinee with an item should not be affected by other items.  It also means that the examinee is in double jeopardy; if they don’t know that topic, they will be getting two questions wrong, not one.  There are other potential issues as well, as discussed in this article.


What does this mean for test development?

We want to identify enemy items and ensure that they don’t get used together.  Your item banking and assessment platform should have functionality to track which items are enemies.  You can sign up for a free account in FastTest to see an example.


creative workplace incremental validity

Incremental validity is an aspect of validity that refers to what an additional assessment or predictive variable can add to the information provided by existing assessments or variables.  It refers to the amount of “bonus” predictive power by adding in another predictor.  In many cases, it is on the same or similar trait, but often the most incremental validity comes from using a predictor/trait that is relatively unrelated to the original.  See examples below.

Note that this is often discussed with respect to tests and assessment, but in many cases a predictor is not a test or assessment, as you will also see.

How is Incremental Validity Evaluated?

It is most often quantified with a linear regression model and correlations.  However, any predictive modeling approach could work from support vector machines to neural networks.

Example of Incremental Validity: University Admissions

One of the most commonly used predictors for university admissions is an admissions test, or battery of tests.  You might be required to take an assessment which includes an English/Verbal test, a Logic/Reasoning test, and a Quantitative/Math test.  These might be used individually or aggregate to create a mathematical model, based on past data, that predicts your performance at university. (there are actually several variables for this, such as first year GPA, final GPA, and 4 year graduation rate, but that’s beyond the scope of this article)

Of course, the admissions exams scores are not the only point of information that the university has on students.  It also has their high school GPA, perhaps an admissions essay which is graded by instructors, and so on.  Incremental validity poses this question: if the admissions exam correlates 0.59 with first year GPA, what happens if we make it into a multiple regression/correlation with High School GPA (HGPA) as a second predictor?  It might go up to, say, 0.64.  There is an increment of 0.05.  If the university has that data from students, they would be wasting it by not using it.

Of course, HGPA will correlate very highly with the admissions exam scores.  So it will likely not add a lot of incremental validity.  Perhaps the school finds that essays add a 0.09 increment to the predictive power, because it is more orthogonal to the admissions exam scores.  Does it make sense to add that, given the additional expense of scoring thousands of essays?  That’s a business decision for them.

Example of Incremental Validity: Pre-Employment Testing

Another common use case is that of pre-employment testing, where the purpose of the test is to predict criterion variables like job performance, tenure, 6-month termination rate, or counterproductive work behavior.  You might start with a skills test; perhaps you are hiring accountants or bookkeepers and you give them a test on MS Excel.  What additional predictive power would we get by also doing a quantitative reasoning test?  Probably some, but that most likely correlates highly with MS Excel knowledge.  So what about using a personality assessment like Conscientiousness?  That would be more orthogonal.  It’s up to the researcher to determine what the best predictors are.  This topic, personnel selection, is one of the primary areas of Industrial/ Organizational Psychology.

students discussing formative summative assessment

Summative and formative assessment are a crucial component of the educational process.  If you work in the educational assessment field or even in educational generally, you have probably encountered these terms.  What do they mean?  This post will explore the differences between summative and formative assessment.

Assessment plays a crucial role in education, serving as a powerful tool to gauge student understanding and guide instructional practices. Among the various assessment methods, two approaches stand out: formative assessment and summative assessment. While both types aim to evaluate student performance, they serve distinct purposes and are applied at different stages of the learning process.

Summative Assessment

Summative assessment refers to an assessment that is at the end (sum) of an educational experience.  The “educational experience” can vary widely.  Perhaps it is a one-day training course, or even shorter.  I worked at a lumber yard in high school, and I remember getting a rudimentary training – maybe an hour – on how to use a forklift before they had me take an exam to become OSHA Certified to used a forklift.  Proctored by the guy who had just showed me the ropes, of course.  On the other end of a spectrum is board certification for a physician specialty like ophthalmology: after 4 years of undergrad, 4 years of med school, and several more years of specialty training, then you finally get to take the exam.  Either way, the purpose is to evaluate what you learned in some educational experience.

Note that it does not have to be formal education.  Many certifications have multiple eligibility pathways.  For example, to be eligible to sit for the exam, you might need:

  1. A bachelor’s degree
  2. An associate degree plus 1 year of work experience
  3. 3 years of work experience.

How it is developed

Summative assessments are usually developed by assessment professionals, or a board of subject matter experts led by assessment professionals.  For example, a certification for ophthalmology is not informally developed by a teacher; there is a panel of experienced ophthalmologists led by a psychometrician.  A high school graduation exam might be developed by a panel of experienced math or English teachers, again led by a psychometrician and test developers.

The process is usually very long and time-intensive, and therefore quite expensive.  A certification will need a job analysis, item writing workshop, standard-setting study, and other important developments that contribute to the validity of the exam scores.  A high school graduation exam has expensive curriculum alignment studies and other aspects.

Implementation of Summative Assessment

Let’s explore the key aspects of summative assessment:

  1. End-of-Term Evaluation: Summative assessments are administered after the completion of a unit, semester, or academic year. They aim to evaluate the overall achievement of students and determine their readiness for advancement or graduation.
  2. Formal and Standardized: Summative assessments are often formal, standardized, and structured, ensuring consistent evaluation across different students and classrooms. Common examples include final exams, standardized tests, and grading rubrics.
  3. Accountability: Summative assessment holds students accountable for their learning outcomes and provides a comprehensive summary of their performance. It also serves as a basis for grade reporting, academic placement, and program evaluation.
  4. Future Planning: Summative assessment results can guide future instructional planning and curriculum development. They provide insights into areas of strength and weakness, helping educators identify instructional strategies and interventions to improve student outcomes.

Formative Assessmentstudent assessment

Formative assessment is something that is used during the educational process.  Everyone is familiar with this from their school days.  A quiz, an exam, or even just the teacher asking you a few questions verbally to understand your level of knowledge.  Usually, but not always, a formative assessment is used to to direct instruction.  A common example of formative assessment is low-stakes exams given in K-12 schools purely to check on student growth, without any counting towards their grades.  Some of the most widely used titles are the NWEA MAP, Renaissance Learning STAR, and Imagine Learning MyPath.

Formative assessment is a great fit for computerized adaptive testing, a method that adapts the difficulty of the exam to each student.  If a student is 3 grades behind, the test will quickly adapt down to that level, providing a better experience for the student and more accurate feedback on their level of knowledge.

How it is developed

Formative assessments are typically much more informal than summative assessments.  Most of the exams we take in our life are informally developed formative assessments; think of all the quizzes and tests you ever took during courses as a student.  Even taking a test during training on the job will often count.  However, some are developed with heavy investment, such as a nationwide K-12 adaptive testing platform.

Implementation of Formative Assessment

Formative assessment refers to the ongoing evaluation of student progress throughout the learning journey. It is designed to provide immediate feedback, identify knowledge gaps, and guide instructional decisions. Here are some key characteristics of formative assessment:

  1. Timely Feedback: Formative assessments are conducted during the learning process, allowing educators to provide immediate feedback to students. This feedback focuses on specific strengths and areas for improvement, helping students adjust their understanding and study strategies.
  2. Informal Nature: Formative assessments are typically informal and flexible, offering a wide range of techniques such as quizzes, class discussions, peer evaluations, and interactive activities. They encourage active participation and engagement, promoting deeper learning and critical thinking skills.
  3. Diagnostic Function: Formative assessment serves as a diagnostic tool, enabling teachers to monitor individual and class-wide progress. It helps identify misconceptions, adapt instructional approaches, and tailor learning experiences to meet students’ needs effectively.
  4. Growth Mindset: The primary goal of formative assessment is to foster a growth mindset among students. By focusing on improvement rather than grades, it encourages learners to embrace challenges, learn from mistakes, and persevere in their educational journey.

The Synergy Between Formative and Summative Assessments

While formative and summative assessments have distinct purposes, they work together in a complementary manner to enhance learning outcomes. Here are a few ways in which these assessment types can be effectively integrated:

  1. Feedback Loop: The feedback provided during formative assessments can inform and improve summative assessments. It allows students to understand their strengths and weaknesses, guiding their study efforts for better performance in the final evaluation.
  2. Continuous Improvement: By employing formative assessments throughout a course, teachers can continuously monitor student progress, identify learning gaps, and adjust instructional strategies accordingly. This iterative process can ultimately lead to improved summative assessment results.
  3. Balanced Assessment Approach: Combining both formative and summative assessments creates a more comprehensive evaluation system. It ensures that student growth and understanding are assessed both during the learning process and at the end, providing a holistic view of

Summative and Formative Assessment: A Validity Perspective

So what is the difference?  You will notice it is the situation and use of the exam, not the exam itself.  You could take those K-12 feedback assessments and deliver them at the end of the year, with weighting towards the student’s final grade.  That would make them summative.  But that is not what the test was designed for.  This is the concept of validity; the evidence showing that interpretations and use of test scores are supported towards their intended use.  So the key is to design a test for its intended use, provide evidence for that use, and make sure that the exam is being used in the way that it should be.

scale-reliability-small

Test score reliability and validity are core concepts in the field of psychometrics and assessment.  Both of them refer to the quality of a test, the scores it produces, and how we use those scores.  Because test scores are often used for very important purposes with high stakes, it is of course paramount that the tests be of high quality.  But because it is such a complex situation, it is not a simple yes/no answer of whether a test is good.  There is a ton of work that goes into establishing validity and reliability, and that work never ends!

This post provide an introduction to this incredibly complex topic.  For more information, we recommend you delve into books that are dedicated to the topic.  Here is a classic.


Why do we need reliability and validity?

To begin a discussion of reliability and validity, let us first pose the most fundamental question in psychometrics: Why are we testing people? Why are we going through an extensive and expensive process to develop examinations, inventories, surveys, and other forms of assessment? The answer is that the assessments provide information, in the form of test scores and subscores, that can be used for practical purposes to the benefit of individuals, organizations, and society. Moreover, that information is of higher quality for a particular purpose than information available from alternative sources. For example, a standardized test can provide better information about school students than parent or teacher ratings. A preemployment test can provide better information about specific job skills than an interview or a resume, and therefore be used to make better hiring decisions.

So, exams are constructed in order to draw conclusions about examinees based on their performance. The next question would be, just how supported are various conclusions and inferences we are making? What evidence do we have that a given standardized test can provide better information about school students than parent or teacher ratings? This is the central question that defines the most important criterion for evaluating an assessment process: validity. Validity, from a broad perspective, refers to the evidence we have to support a given use or interpretation of test scores. The importance of validity is so widely recognized that it typically finds its way into laws and regulations regarding assessment (Koretz, 2008).

Test score reliability is a component of validity. Reliability indicates the degree to which test scores are stable, reproducible, and free from measurement error. If test scores are not reliable, they cannot be valid since they will not provide a good estimate of the ability or trait that the test intends to measure. Reliability is therefore a necessary but not sufficient condition for validity.


Test Score Reliability

Reliability refers to the precision, accuracy, or repeatability of the test scores. There is no universally accepted way to define and evaluate the concept; classical test theory provides several indices, while item response theory drops the idea of a single index (and drops the term “reliability” entirely!) and reconceptualizes it as a conditional standard error of measurement, an index of precision.  This is actuall a very important distinction, though outside the scope of this article.

An extremely common way of evaluating classical test reliability is the internal consistency index, called KR-20 or α (alpha). The KR-20 index ranges from 0.0 (test scores are comprised only of random error) to 1.0 (scores have no measurement error). Of course, because human behavior is generally not perfectly reproducible, perfect reliability is not possible; typically, a reliability of 0.90 or higher is desired for high-stakes certification exams. The relevant standard for a test depends on its stakes. A test for medical doctors might require reliability of 0.95 or greater. A test for florists or a personality self-assessment might suffice with 0.80.

Reliability depends on several factors, including the stability of the construct, length of the test, and the quality of the test items.

  • Stability of the construct: Reliability will be higher if the trait/ability is more stable (mood is inherently difficult to measure repeatedly). A test sponsor typically has little control over the nature of the construct – if you need to measure knowledge of algebra, well, that’s what we have to measure, and there’s no way around that.
  • Length of the test: Obviously, a test with 100 items is going to produce better scores than one with 5 items, assuming the items are not worthless.
  • Item Quality: A test will have higher reliability if the items are good.  Often, this is operationalized as point-biserial discrimination coefficients.

How to you calculate reliability?  You need psychometric analysis software like Iteman.


Validity

Validity is conventionally defined as the extent to which a test measures what it purports to measure.  Test validation is the process of gathering evidence to support the inferences made by test scores. Validation is an ongoing process which makes it difficult to know when one has reached a sufficient amount of validity evidence to interpret test scores appropriately.

Academically, Messick (1989) defines validity as an “integrated evaluative judgment of the degree to which empirical evidence and theoretical rationales support the adequacy and appropriateness of inferences and actions based on test scores or other modes of measurement.” This definition suggests that the concept of validity contains a number of important characteristics to review or propositions to test and that validity can be described in a number of ways. The modern concept of validity (AERA, APA, & NCME Standards) is multi-faceted and refers to the meaningfulness, usefulness, and appropriateness of inferences made from test scores.

First of all, validity is not an inherent characteristic of a test. It is the reasonableness of using the test score for a particular purpose or for a particular inference. It is not correct to say a test or measurement procedure is valid or invalid. It is more reasonable to ask, “Is this a valid use of test scores or is this a valid interpretation of the test scores?” Test score validity evidence should always be reviewed in relation to how test scores are used and interpreted.  Example: we might use a national university admissions aptitude test as a high school graduation exam, since they occur in the same period of a student’s life.  But it is likely that such a test does not match the curriculum of a particular state, especially since aptitude and achievement are different things!  You could theoretically use the aptitude test as a pre-employment exam as well; while valid in its original use it is likely not valid in that use.

Secondly, validity cannot be adequately summarized by a single numerical index like a reliability coefficient or a standard error of measurement. A validity coefficient may be reported as a descriptor of the strength of relationship between other suitable and important measurements. However, it is only one of many pieces of empirical evidence that should be reviewed and reported by test score users. Validity for a particular test score use is supported through an accumulation of empirical, theoretical, statistical, and conceptual evidence that makes sense for the test scores.

Thirdly, there can be many aspects of validity dependent on the intended use and intended inferences to be made from test scores. Scores obtained from a measurement procedure can be valid for certain uses and inferences and not valid for other uses and inferences. Ultimately, an inference about probable job performance based on test scores is usually the kind of inference desired in test score interpretation in today’s test usage marketplace. This can take the form of making an inference about a person’s competency measured by a tested area.

Example 1: A Ruler

A standard ruler has both reliability and validity.  If you measure something that is 10 cm long, and measure it again and again, you will get the same measurement.  It is highly consistent and repeatable.  And if the object is actually 10 cm long, you have validity. (If not, you have a bad ruler.)

Example 2: A Bathroom Scale

Bathroom scales are not perfectly reliable (though this is often a function of their price).  But that meets the reliability requirements of this measurement.

  • If you weigh 180 lbs, and step on the scale several times, you will likely get numbers like 179.8 or 180.1.  That is quite reliable, and valid.
  • If the numbers were more spread out, like 168.9 and 185.7, then you can consider it unreliable but valid.
  • If the results were 190.00 lbs every time, you have perfectly reliable measurement… but poor validity
  • If the results were spread like 25.6, 2023.7, 0.000053 – then it is neither reliable or valid.

This is similar to the classic “target” example of reliability and validity, like you see below (image from Wikipedia).

Reliability_and_validity

Example 3: A Pre-Employment Test

Now, let’s get to a real example.  You have a test of quantitative reasoning that is being used to assess bookkeepers that apply for a job at a large company.  Jack has very high ability, and scores around the 90th percentile each time he takes the test.  This is reliability.  But does it actually predict job performance?  That is validity.  Does it predict job performance better than a Microsoft Excel test?  Good question, time for some validity research.  What if we also tack on a test of conscientiousness?  That is incremental validity.


Summary

In conclusion, and validity and reliability are two essential aspects in evaluating an assessment , be it an examination of knowledge, a psychological inventory, a customer survey, or an aptitude test. Validity is an overarching, fundamental issue that drives at the heart of the reason for the assessment in the first place: the use of test scores. Reliability is an aspect of validity, as it is a necessary but not sufficient condition. Developing a test that produces reliable scores and valid interpretations is not an easy task, and progressively higher stakes indicate a progressively greater need for a professional psychometrician.  High-stakes exams like national university admissions often have teams of experts devoted to producing a high quality assessment.

certification exam development construction

Certification exam development, as well as other credentialing like licensure or certificates, is incredibly important.  Such exams serve as gatekeepers into many professions, often after people have invested a ton of money and years of their life in preparation.  Therefore, it is critical that the tests be developed well, and have the necessary supporting documentation to show that they are defensible.  So what exactly goes into developing a quality exam, sound psychometrics, and establishing the validity documentation, perhaps enough to achieve NCCA accreditation for your certification?

Well, there is a well-defined and recognized process for certification exam development, though it is rarely the exact same for every organization.  In general, the accreditation guidelines say you need to address these things, but leave the specific approach up to you.  For example, you have to do a cutscore study, but you are allow to choose Bookmark vs Angoff vs other method.


Job Analysis / Practice Analysis

A job analysis study provides the vehicle for defining the important job knowledge, skills, and abilities (KSA) that will later be translated into content on a certification exam. During a job analysis, important job KSAs are obtained by directly analyzing job performance of highly competent job incumbents or surveying subject-matter experts regarding important aspects of successful job performance. The job analysis generally serves as a fundamental source of evidence supporting the validity of scores for certification exams.


Test Specifications and Blueprints

The results of the job analysis study are quantitatively converted into a blueprint for the exam.  Basically, it comes down to this: if the experts say that a certain topic or skill is done quite often or is very critical, then it deserves more weight on the exam, right?  There are different ways to do this.  My favorite article on the topic is Raymond & Neustel, 2006Here’s a free tool to help.


test development cycle job task analysis

Item Development

After important job KSAs are established, subject-matter experts write test items to assess them. The end result is the development of an item bank from which exam forms can be constructed. The quality of the item bank also supports test validity.  A key operational step is the development of an Item Writing Guide and holding an item writing workshop for the SMEs.


Pilot Testing

There should be evidence that each item in the bank actually measures the content that it is supposed to measure; in order to assess this, data must be gathered from samples of test-takers. After items are written, they are generally pilot tested by administering them to a sample of examinees in a low-stakes context—one in which examinees’ responses to the test items do not factor into any decisions regarding competency. After pilot test data is obtained, a psychometric analysis of the test and test items can be performed. This analysis will yield statistics that indicate the degree to which the items measure the intended test content. Items that appear to be weak indicators of the test content generally are removed from the item bank or flagged for item review so they can be reviewed by subject matter experts for correctness and clarity.

Note that this is not always possible, and is one of the ways that different organizations diverge in how they approach exam development.


Standard Setting

Standard setting also is a critical source of evidence supporting the validity of professional credentialing exam (i.e. pass/fail) decisions made based on test scores.  Standard setting is a process by which a passing score (or cutscore) is established; this is the point on the score scale that differentiates between examinees that are and are not deemed competent to perform the job. In order to be valid, the cutscore cannot be arbitrarily defined. Two examples of arbitrary methods are the quota (setting the cut score to produce a certain percentage of passing scores) and the flat cutscore (such as 70% on all tests). Both of these approaches ignore the content and difficulty of the test.  Avoid these!

Instead, the cutscore must be based on one of several well-researched criterion-referenced methods from the psychometric literature.  There are two types of criterion-referenced standard-setting procedures (Cizek, 2006): examinee-centered and test-centered.

The Contrasting Groups method is one example of a defensible examinee-centered standard-setting approach. This method compares the scores of candidates previously defined as Pass or Fail. Obviously, this has the drawback that a separate method already exists for classification. Moreover, examinee-centered approaches such as this require data from examinees, but many testing programs wish to set the cutscore before publishing the test and delivering it to any examinees. Therefore, test-centered methods are more commonly used in credentialing.

The most frequently used test-centered method is the Modified Angoff Method (Angoff, 1971) which requires a committee of subject matter experts (SMEs).  Another commonly used approach is the Bookmark Method.


Equating

If the test has more than one form – which is required by NCCA Standards and other guidelines – they must be statistically equated.  If you use classical test theory, there are methods like Tucker or Levine.  If you use item response theory, you can either bake the equating into the item calibration process with software like Xcalibre, or use conversion methods like Stocking & Lord.

What does this process do?  Well, if this year’s certification exam had an average of 3 points higher than last years, how do you know if this year’s version was 3 points easier, or this year’s cohort was 3 points smarter, or a mixture of both?  Learn more here.


Psychometric Analysis & Reporting

This part is an absolutely critical step in the exam development cycle for professional credentialing.  You need to statistically analyze the results to flag any items that are not performing well, so you can replace or modify them.  This looks at statistics like item p-value (difficulty), item point biserial (discrimination), option/distractor analysis, and differential item functioning.  You should also look at overall test reliability/precision and other psychometric indices.  If you are accredited, you need to perform year-end reports and submit them to the governing body.  Learn more about item and test analysis.


Exam Development: It’s a Vicious Cycle

Now, consider the big picture: in many cases, an exam is not a one-and-done thing.  It is re-used, perhaps continually.  Often there are new versions released, perhaps based on updated blueprints or simply to swap out questions so that they don’t get overexposed.  That’s why this is better conceptualized as an exam development cycle, like the circle shown above.  Often some steps like Job Analysis are only done once every 5 years, while the rotation of item development, piloting, equating, and psychometric reporting might happen with each exam window (perhaps you do exams in December and May each year).

ASC has extensive expertise in managing this cycle for professional credentialing exams, as well as many other types of assessments.  Get in touch with us to talk to one of our psychometricians.

students-taking-digital-test

Digital assessment (DA) aka e-Assessment is the delivery of assessments, tests, surveys, and other measures via digital devices such as computers, tablets, and mobile phones.  It typically leverages additional technology such as the Internet or Intranets.  The primary goal is to be able to develop items, publish tests, deliver tests, and provide meaningful results – as quickly, easily, and validly as possible. To produce digital assessment, its design, performance, and feedback must be driven by modern technology, typically cloud-based digital assessment platforms.  Such platforms do much more than just the delivery though, and modules include:test development cycle fasttest


Why is Digital Assessment / e-Assessment Getting So Popular?

Obviously, it is not solely because of the pandemic, it is because people have seen that things can be done differently and in more efficient ways than before. Globalization and digital technology are rapidly changing the world of education. Teaching and learning are becoming more learner-centric, and technology provides an opportunity for assessment to be integrated into the learning process with corresponding adjustments. Furthermore, digital technology grants opportunities for teaching and learning to move their focus from content to critical thinking. Teachers are already implementing new strategies in classrooms, and assessment needs to reflect these changes, as well. Even after the pandemic ends, the education will never be the way it was before, and the world will have to admit the benefits that DA brings. Let’s look critically at pros and cons of DA.

Looking for such a platform?  Request a free account in ASC’s industry-leading e-Assessment ecosystem.


Free FastTest Account


Advantages of Digital Assessment

  • Accessibility

One of the main pros of DA is the ease-of-use for staff and learners—examiners can easily set up questionnaires, determine grading methods, and send invitations to examinees. In turn, examinees do not always have to be in a classroom setting to take assessments and can do it remotely in a more comfortable environment. In addition, DA gives learners the option of taking practice tests whenever they are available for that.

  • Transparency

DA allows educators quickly evaluate performance of a group against an individual learner for analytical and pedagogical reasons. Report-generating capabilities of DA enable educators to identify learning problem areas on both individual and group levels soon after assessments occur in order to adapt to learners’ needs, strengths, and weaknesses. As for learners, DA provides them with instant feedback, unlike traditional paper exams.

  • Profitability

Conducting exams online, especially those at scale, seems very practical since there is no need to print innumerable question papers, involve all school staff in organization of procedures, assign invigilators, invite hundreds of students to spacious classrooms to take tests, and provide them with answer-sheets and supplementary materials. Thus, flexibility of time and venue, lowered human, logistic and administrative costs lend considerable preeminence to DA over traditional exam settings.

  • Eco-friendliness

In this digital era, our utmost priority should be minimizing detrimental effects on the environment that pen-and-paper exams bring. Mercilessly cutting down trees for paper can no longer be the norm as it has the adverse environmental impact. DA will ensure that organizations and institutions can go paper-free and avoid printing exam papers and other materials. Furthermore, DAs take up less storage space since all data can be stored on a single server, especially in respect to keeping records in paper.

  • Security

Enhanced privacy for students is another advantage of DA that validates its utility. There is a tiny probability of malicious activities, such as cheating and other unlawful practices that can potentially rig the system and lead to incorrect results. Secure assessment system supported by AI-based proctoring features makes students embrace test results without contesting them, which, in turn, fosters a more positive mindset toward institutions and organizations building a stronger mutual trust between educators and learners.

  • Autograding

The benefits of DA include setting up an automated grading system, more convenient and time-efficient than standard marking and grading procedures, which minimizes human error. Automated scoring juxtaposes examinees’ responses against model answers and makes relevant judgements. The dissemination of technology in e-education and the increasing number of learners demand a sophisticated scoring mechanism that would ease teachers’ burden, save a lot of time, and ensure fairness of assessment results. For example, digital assessment platforms can include complex modules for essay scoring, or easily implement item response theory and computerized adaptive testing.

  • Time-efficiency

Those involved in designing, managing and evaluating assessments are aware of the tediousness of these tasks. Probably, the most routine process among assessment procedures is manual invigilation which can be easily avoided by employing proctoring services. Smart exam software, such as FastTest, features the options of automated item generation, item banking, test assembling and publishing, saving precious time that would otherwise be wasted on repetitive tasks. Examiners should only upload the examinees’ emails or ids to invite them for assessment. The best part about it all is instant exporting of results and delivering reports to stakeholders.

  • Public relations and visibility

There is a considerably lower use of pen and paper in the digital age. The infusion of technology has considerably altered human preferences, so these days an immense majority of educators rely more on computers for communication, presentations, digital designing, and other various tasks. Educators have an opportunity to mix question styles on exams, including graphics, to make them more interactive than paper ones. Many educational institutions utilize learning management systems (LMS) for publishing study materials on the cloud-based platforms and enabling educators to evaluate and grade with ease. In turn, students benefit from such systems as they can submit their assignments remotely.


Disadvantages of Digital Assessment

  • Difficulty in grading long-answer questions

DA copes brilliantly with multiple-choice questions; however, there are still some challenges with grading long-answer questions. This is where Digital e-Assessment intersects with the traditional one as subjective answers ask for manual grading. Luckily, technology in the education sector continues to evolve and even essays can already be marked digitally with a help of AI-features on the platforms like FastTest.

  • Need to adapt

Implementing something new always brings disruption and demands some time to familiarize all stakeholders with it. Obviously, transition from traditional assessment to DA will require certain investments to upgrade the system, such as professional development of staff and finances. Some staff and students might even resist this tendency and feel isolated without face-to-face interactions. However, this stage is inevitable and will definitely be a step forward for both educators and learners.

  • Infrastructural barriers & vulnerability

One of the major cons of DA is that technology is not always reliable and some locations cannot provide all examinees with stable access to electricity, internet connection, and other basic system requirements. This is a huge problem in developing nations, and still remains a problem in many areas of well-developed nations. In addition, integrating DA technology might be very costly in case of wrong strategies while planning assessment design, both conceptual and aesthetic. Such barriers hamper DA, which is why authorities should consider addressing them prior to implementing DA.


Conclusion

To sum up, implementing DA has its merits and demerits, as outlined above. Even though technology simplifies and enhances many processes for institutions and stakeholders, it still has some limitations. Nevertheless, all possible drawbacks can be averted by choosing the right methodology and examination software. We cannot reject the necessity to transit from traditional form of assessment to digital one, admitting that the benefits of DA outweigh its drawbacks and costs by far. Of course, it is up to you to choose whether to keep using hard copy assessments or go for online option. However, we believe that in the digital era all we need to do is to plan wisely and choose an easy-to-use and robust examination platform with AI-based anti-cheating measures, such as FastTest, to secure credible outcomes.


Reference

Wall, J. E. (2000). Technology-Delivered Assessment: Diamonds or Rocks? ERIC Clearinghouse on Counseling and Student Services.


student-progress-monitoring

Progress monitoring is an essential component of a modern educational system. Are you interested in tracking learners’ academic achievements during a period of learning, such as a school year? Then you need to design a valid and reliable progress monitoring system that would enable educators assist students in achieving a performance target. Progress monitoring is a standardized process of assessing a specific construct or a skill that should take place often enough to make pedagogical decisions and take appropriate actions.


Why Progress monitoring?

Progress monitoring mainly serves two purposes: to identify students in need and to adjust instructions based on assessment results. Such adjustments can be used on both individual and aggregate levels of learning. Educators should use progress monitoring data to make decisions about whether appropriate interventions should be employed to ensure that students obtain support to propel their learning and match their needs (Issayeva, 2017).

This assessment is usually criterion-referenced and not normed. Data collected after administration can show a discrepancy between students’ performances in relation to the expected outcomes, and can be graphed to display a change in rate of progress over time.

Progress monitoring dates back to the 1970s when Deno and his colleagues at the University of Minnesota initiated research on applying this type of assessment to observe student progress and identify the effectiveness of instructional interventions (Deno, 1985, 1986; Foegen et al., 2008). Positive research results suggested to use progress monitoring as a potential solution of the educational assessment issues existing in the late 1980s–early 1990s (Will, 1986).


Approaches to development of measures

Two approaches to item development are highly applicable these days: robust indicators and curriculum sampling (Fuchs, 2004). It is interesting to note, that advantages of using one approach tend to mirror disadvantages of the other one.

According to Foegen et al. (2008), robust indicators represent core competencies integrating a variety of concepts and skills. Classic examples of robust indicator measures are oral reading fluency in reading and estimation in Mathematics. The most popular illustration of this case is the Programme for International Student Assessment (PISA) that evaluates preparedness of students worldwide to apply obtained knowledge and skills in practice regardless of the curriculum they study at schools (OECD, 2012).

When using the second approach, a curriculum is analyzed and sampled in order to construct measures based on its proportional representations. Due to the direct link to the instructional curriculum, this approach enables teachers to evaluate student learning outcomes, consider instructional changes, and determine eligibility for other educational services. Progress monitoring is especially applicable when curriculum is spiral (Bruner, 2009) since it allows students revisit the same topics with increasing complexity.


CBM and CAT

Curriculum-based measures (CBMs) are commonly used for progress monitoring purposes. They typically embrace standardized procedures for item development, administration, scoring, and reporting. CBMs are usually conducted under timed conditions as this allows obtain evidence of a student’s fluency within a targeted skill.

Computerized adaptive tests (CATs) are gaining more and more popularity these days, particularly within progress monitoring framework. CATs were primarily developed to replace traditional fixed-length paper-and-pencil tests and have been proven to become a helpful tool determining each learner’s achievement levels (Weiss & Kingsbury, 1984).

CATs utilize item response theory (IRT) and provide students with subsequent items based on difficulty level and their answers in real time. In brief, IRT is a statistical method that parameterizes items and examinees on the same scale, and facilitates stronger psychometric approaches such as CAT (Weiss, 2004). Thompson and Weiss (2011) suggest a step-by-step guidance on how to build CATs.


Progress monitoring vs. traditional assessments

Progress monitoring significantly differs from traditional classroom assessments by many reasons. First, it provides objective, reliable, and valid data on student performance, e. g. in terms of the mastery of a curriculum. Subjective judgement is unavoidable for teachers when they prepare classroom assessments for their students. On the contrary, student progress monitoring measures and procedures are standardized which guarantees relative objectivity, as well as reliability and validity of assessment results (Deno, 1985; Foegen & Morrison, 2010). In addition, progress monitoring results are not graded, and there is no preparation prior to the test. Second, it leads to thorough feedback from teachers to students. Competent feedback helps teachers adapt their teaching methods or instructions in response to their students’ needs (Fuchs & Fuchs, 2011). Third, progress monitoring enables teachers help students in achieving long-term curriculum goals by tracking their progress in learning (Deno et al., 2001; Stecker et al., 2005). According to Hintze, Christ, and Methe (2005), progress monitoring data assist teachers in identifying specific actions towards instructional changes in order to help students in mastering all learning objectives from the curriculum. Ultimately, this results in a more effective preparation of students for the final high-stakes exams.


References

Bruner, J. S. (2009). The process of education. Harvard University Press.

Deno, S. L. (1985). Curriculum-based measurement: The emerging alternative. Exceptional children, 52, 219-232.

Deno, S. L. (1986). Formative evaluation of individual student programs: A new role of school psychologists. School Psychology Review, 15, 358-374.

Deno, S. L., Fuchs, L. S., Marston, D., & Shin, J. (2001). Using curriculum-based measurement to establish growth standards for students with learning disabilities. School Psychology Review, 30(4), 507-524.

Foegen, A., & Morrison, C. (2010). Putting algebra progress monitoring into practice: Insights from the field. Intervention in School and Clinic46(2), 95-103.

Foegen, A., Olson, J. R., & Impecoven-Lind, L. (2008). Developing progress monitoring measures for secondary mathematics: An illustration in algebra. Assessment for Effective Intervention33(4), 240-249.

Fuchs, L. S. (2004). The past, present, and future of curriculum-based measurement research. School Psychology Review, 33, 188-192.

Fuchs, L. S., & Fuchs, D. (2011). Using CBM for Progress Monitoring in Reading. National Center on Student Progress Monitoring.

Hintze, J. M., Christ, T. J., & Methe, S. A. (2005). Curriculum-based assessment. Psychology in the School, 43, 45–56. doi: 10.1002/pits.20128

Issayeva, L. B. (2017). A qualitative study of understanding and using student performance monitoring reports by NIS Mathematics teachers [Unpublished master’s thesis]. Nazarbayev University.

Samson, J. M. (2016). Human trafficking and globalization [Unpublished doctoral dissertation]. Virginia Polytechnic Institute and State University.

OECD (2012). Lessons from PISA for Japan, Strong Performers and Successful Reformers in Education. OECD Publishing.

Stecker, P. M., Fuchs, L. S., & Fuchs, D. (2005). Using curriculum-based measurement to improve student achievement: Review of research. Psychology in the Schools, 42(8), 795-819.

Thompson, N. A., & Weiss, D. A. (2011). A framework for the development of computerized adaptive tests. Practical Assessment, Research, and Evaluation16(1), 1.

Weiss, D. J., & Kingsbury, G. G. (1984). Application of computerized adaptive testing to educational problems. Journal of Educational Measurement21(4), 361-375.

Weiss, D. J. (2004). Computerized adaptive testing for effective and efficient measurement in counseling and education. Measurement and Evaluation in Counseling and Development37(2), 70-84.

Will, M. C. (1986). Educating children with learning problems: A shared responsibility. Exceptional children52(5), 411-415.


vertical scaling

Vertical scaling is the process of placing scores from educational assessments that measure the same knowledge domain but at different ability levels onto a common scale (Tong & Kolen, 2008). The most common example is putting Mathematics and Language assessments for K-12 onto a single scale. For example, you might have Grade 4 math curriculum, Grade 5, Grade 6… instead of treating them all as islands, we consider the entire journey and link the grades together in a single item bank. While general information about scaling can be found at What is Scaling?, this article will focus specifically on vertical scaling.

Why vertical scaling?

A vertical scale is incredibly important, as enables inferences about student progress from one moment to another, e. g. from elementary to high school grades, and can be considered as a developmental continuum of student academic achievements. In other words, students move along that continuum as they develop new abilities, and their scale score alters as a result (Briggs, 2010).

This is not only important for individual students, because we can track learning and assign appropriate interventions or enrichments, but also in an aggregate sense.  Which schools are growing more than others?  Are certain teachers better? Perhaps there is a noted difference between instructional methods or curricula?  Here, we are coming up to the fundamental purpose of assessment; just like it is necessary to have a bathroom scale to track your weight in a fitness regime, if a governments implements a new Math instructional method, how does it know that students are learning more effectively?

Using a vertical scale can create a common interpretive framework for test results across grades and, therefore, provide important data that inform individual and classroom instruction. To be valid and reliable, these data have to be gathered based on properly constructed vertical scales.

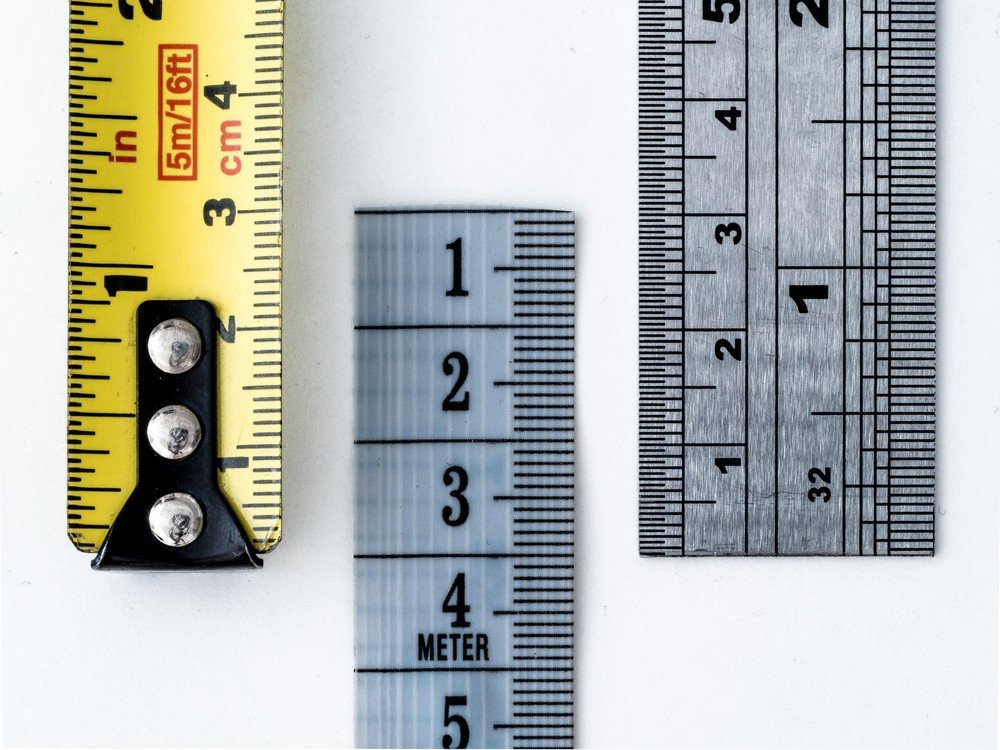
Vertical scales can be compared with rulers that measure student growth in some subject areas from one testing moment to another. Similarly to height or weight, student capabilities are assumed to grow with time.  However, if you have a ruler that is only 1 meter long and you are trying to measure growth 3-year-olds to 10-year-olds, you would need to link two rulers together.

Construction of Vertical Scales

Construction of a vertical scale is a complicated process which involves making decisions on test design, scaling design, scaling methodology, and scale setup. Interpretation of progress on a vertical scale depends on the resulting combination of such scaling decisions (Harris, 2007; Briggs & Weeks, 2009). Once a vertical scale is established, it needs to be maintained over different forms and time. According to Hoskens et al. (2003), a method chosen for maintaining vertical scales affects the resulting scale, and, therefore, is very important.

A measurement model that is used to place student abilities on a vertical scale is represented by item response theory (IRT; Lord, 2012; De Ayala, 2009) or the Rasch model (Rasch, 1960).  This approach allows direct comparisons of assessment results based on different item sets (Berger et al., 2019). Thus, each student is supposed to work with a selected bunch of items not similar to the items taken by other students, but still his results will be comparable with theirs, as well as with his own ones from other assessment moments.

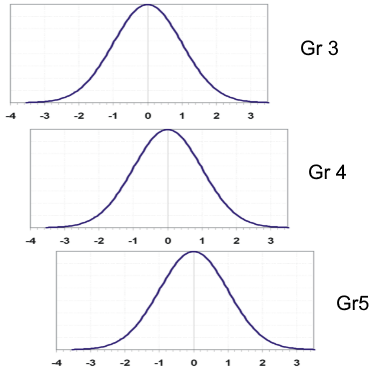
The image below shows how student results from different grades can be conceptualized by a common vertical scale.  Suppose you were to calibrate data from each grade separately, but have anchor items between the three groups.  A linking analysis might suggest that Grade 4 is 0.5 logits above Grade 3, and Grade 5 is 0.7 logits above Grade 4.  You can think of the bell curves overlapped like you see below.  A theta of 0.0 on the Grade 5 scale is equivalent to 0.7 on the Grade 4 scale, and 1.3 on the Grade 3 scale.  If you have a strong linking, you can put Grade 3 and Grade 4 items/students onto the Grade 5 scale… as well as all other grades using the same approach.

Vertical-scaling

Test design

Kolen and Brennan (2014) name three types of test designs aiming at collecting student response data that need to be calibrated:

  • Equivalent group design. Student groups with presumably comparable ability distributions within a grade are randomly assigned to answer items related to their own or an adjacent grade;
  • Common item design. Using identical items to students from adjacent grades (not requiring equivalent groups) to establish a link between two grades and to align overlapping item blocks within one grade, such as putting some Grade 5 items on the Grade 6 test, some Grade 6 items on the Grade 7 test, etc.;
  • Scaling test design. This type is very similar to common item design but, in this case, common items are shared not only between adjacent grades; there is a block of items administered to all involved grades besides items related to the specific grade.

From a theoretical perspective, the most consistent design with a domain definition of growth is scaling test design. Common item design is the easiest one to implement in practice but only if administering the same items to adjacent grades is reasonable from a content perspective. Equivalent group design requires more complicated administration procedures within one school grade to ensure samples with equivalent ability distributions.

Scaling design

The scaling procedure can use observed scores or it can be IRT-based. The most commonly used scaling design procedures in vertical scale settings are the Hieronymus, Thurstone, and IRT scaling (Yen, 1986; Yen & Burket, 1997; Tong & Harris, 2004). An interim scale is chosen in all these three methodologies (von Davier et al., 2006).

  • Hieronymus scaling. This method uses a total number-correct score for dichotomously scored tests or a total number of points for polytomously scored items (Petersen et al., 1989). The scaling test is constructed in a way to represent content in an increasing order in terms of level of testing, and it is administered to a representative sample from each testing level or grade. The within- and between-level variability and growth are set on an external scaling test, which is the special set of common items.
  • Thurstone scaling. According to Thurstone (1925, 1938), this method first creates an interim-score-scale and then normalizes distributions of variables at each level or grade. It assumes that scores on an underlying scale are normally distributed within each group of interest and, therefore, makes use of a total number-correct scores for dichotomously scored tests or a total number of points of polytomously scored items to conduct scaling. Thus, Thurstone scaling normalizes and linearly equates raw scores, and it is usually conducted within equivalent groups.
  • IRT scaling. This method of scaling considers person-item interactions. Theoretically, IRT scaling is applied for all existing IRT models, including multidimensional IRT models or diagnostic models. In practice, only unidimensional models, such as the Rasch and/or partial credit models (PCM) or the 3PL models, are used (von Davier et al., 2006).

Data calibration

When all decisions are taken, including test design and scaling design, and tests are administered to students, the items need to be calibrated with software like Xcalibre to establish a vertical measurement scale. According to Eggen and Verhelst (2011), item calibration within the context of the Rasch model implies the process of establishing model fit and estimating difficulty parameter of an item based on response data by means of maximum likelihood estimation procedures.

Two procedures, concurrent and grade-by-grade calibration, are employed to link IRT-based item difficulty parameters to a common vertical scale across multiple grades (Briggs & Weeks, 2009; Kolen & Brennan, 2014). Under concurrent calibration, all item parameters are estimated in a single run by means of linking items shared by several adjacent grades (Wingersky & Lord, 1983).  In contrast, under grade-by-grade calibration, item parameters are estimated separately for each grade and then transformed into one common scale via linear methods. The most accurate method for determining linking constants by minimizing differences between linking items’ characteristic curves among grades is the Stocking and Lord method (Stocking & Lord, 1983). This is accomplished with software like IRTEQ.

Summary of Vertical Scaling

Vertical scaling is an extremely important topic in the world of educational assessment, especially K-12 education.  As mentioned above, this is not only because it facilitates instruction for individual students, but is the basis for information on education at the aggregate level.

There are several approaches to implement vertical scaling, but the IRT-based approach is very compelling.  A vertical IRT scale enables representation of student ability across multiple school grades and also item difficulty across a broad range of difficulty. Moreover, items and people are located on the same latent scale. Thanks to this feature, the IRT approach supports purposeful item selection and, therefore, algorithms for computerized adaptive testing (CAT). The latter use preliminary ability estimates for picking the most appropriate and informative items for each individual student (Wainer, 2000; van der Linden & Glas, 2010).  Therefore, even if the pool of items is 1,000 questions stretching from kindergarten to Grade 12, you can deliver a single test to any student in the range and it will adapt to them.  Even better, you can deliver the same test several times per year, and because students are learning, they will receive a different set of items.  As such, CAT with a vertical scale is an incredibly fitting approach for K-12 formative assessment.

Additional Reading

Reckase (2010) states that the literature on vertical scaling is scarce going back to the 1920s, and recommends some contemporary practice-oriented research studies:

Paek and Young (2005). This research study dealt with the effects of Bayesian priors on the estimation of student locations on the continuum when using a fixed item parameter linking method. First, a within group calibration was done for one grade level; then the parameters from the common items in that calibration were fixed to calibrate the next grade level. This approach forces the parameter estimates to be the same for the common items at the adjacent grade levels. The study results showed that the prior distributions could affect the results and that careful checks should be done to minimize the effects.

Reckase and Li (2007). This book chapter depicts a simulation study of the dimensionality impacts on vertical scaling. Both multidimensional and unidimensional IRT models were employed to simulate data to observe growth across three achievement constructs. The results presented that the multidimensional model recovered the gains better than the unidimensional models, but those gains were underestimated mostly due to the common item selection. This emphasizes the importance of using common items that cover all of the content assessed at adjacent grade levels.

Li (2007). The goal of this doctoral dissertation was to identify if multidimensional IRT methods could be used for vertical scaling and what factors might affect the results. This study was based on a simulation designed to match state assessment data in Mathematics. The results showed that using multidimensional approaches was feasible, but it was important that the common items would include all the dimensions assessed at the adjacent grade levels.

Ito, Sykes, and Yao (2008). This study compared concurrent and separate grade group calibration while developing a vertical scale for nine consequent grades tracking student competencies in Reading and Mathematics. The research study used the BMIRT software implementing Markov-chain Monte Carlo estimation. The results showed that concurrent and separate grade group calibrations had provided different results for Mathematics than for Reading. This, in turn, confirms that the implementation of vertical scaling is very challenging, and combinations of decisions about its construction can have noticeable effects on the results.

Briggs and Weeks (2009). This research study was based on real data using item responses from the Colorado Student Assessment Program. The study compared vertical scales based on the 3PL model with those from the Rasch model. In general, the 3PL model provided vertical scales with greater rises in performance from year to year, but also greater increases within grade variability than the scale based on the Rasch model did. All methods resulted in growth curves having less gain along with an increase in grade level, whereas the standard deviations were not much different in size at different grade levels.

References

Berger, S., Verschoor, A. J., Eggen, T. J., & Moser, U. (2019, October). Development and validation of a vertical scale for formative assessment in mathematics. In Frontiers in Education (Vol. 4, p. 103). Frontiers. Retrieved from https://www.frontiersin.org/articles/10.3389/feduc.2019.00103/full

Briggs, D. C., & Weeks, J. P. (2009). The impact of vertical scaling decisions on growth interpretations. Educational Measurement: Issues and Practice, 28(4), 3–14.

Briggs, D. C. (2010). Do Vertical Scales Lead to Sensible Growth Interpretations? Evidence from the Field. Online Submission. Retrieved from https://files.eric.ed.gov/fulltext/ED509922.pdf

De Ayala, R. J. (2009). The Theory and Practice of Item Response Theory. New York: Guilford Publications Incorporated.

Eggen, T. J. H. M., & Verhelst, N. D. (2011). Item calibration in incomplete testing designs. Psicológica 32, 107–132.

Harris, D. J. (2007). Practical issues in vertical scaling. In Linking and aligning scores and scales (pp. 233–251). Springer, New York, NY.

Hoskens, M., Lewis, D. M., & Patz, R. J. (2003). Maintaining vertical scales using a common item design. In annual meeting of the National Council on Measurement in Education, Chicago, IL.

Ito, K., Sykes, R. C., & Yao, L. (2008). Concurrent and separate grade-groups linking procedures for vertical scaling. Applied Measurement in Education, 21(3), 187–206.

Kolen, M. J., & Brennan, R. L. (2014). Item response theory methods. In Test Equating, Scaling, and Linking (pp. 171–245). Springer, New York, NY.

Li, T. (2007). The effect of dimensionality on vertical scaling (Doctoral dissertation, Michigan State University. Department of Counseling, Educational Psychology and Special Education).

Lord, F. M. (2012). Applications of item response theory to practical testing problems. Routledge.

Paek, I., & Young, M. J. (2005). Investigation of student growth recovery in a fixed-item linking procedure with a fixed-person prior distribution for mixed-format test data. Applied Measurement in Education, 18(2), 199–215.

Petersen, N. S., Kolen, M. J., & Hoover, H. D. (1989). Scaling, norming, and equating. In R. L. Linn (Ed.), Educational measurement (3rd ed., pp. 221–262). New York: Macmillan.

Rasch, G. (1960). Probabilistic Models for Some Intelligence and Attainment Tests. Copenhagen: Danmarks Paedagogiske Institut.

Reckase, M. D., & Li, T. (2007). Estimating gain in achievement when content specifications change: a multidimensional item response theory approach. Assessing and modeling cognitive development in school. JAM Press, Maple Grove, MN.

Reckase, M. (2010). Study of best practices for vertical scaling and standard setting with recommendations for FCAT 2.0. Unpublished manuscript. Retrieved from https://www.fldoe.org/core/fileparse.php/5663/urlt/0086369-studybestpracticesverticalscalingstandardsetting.pdf

Stocking, M. L., & Lord, F. M. (1983). Developing a common metric in item response theory. Applied psychological measurement, 7(2), 201–210. doi:10.1177/014662168300700208

Thurstone, L. L. (1925). A method of scaling psychological and educational tests. Journal of educational psychology, 16(7), 433–451.

Thurstone, L. L. (1938). Primary mental abilities (Psychometric monographs No. 1). Chicago: University of Chicago Press.

Tong, Y., & Harris, D. J. (2004, April). The impact of choice of linking and scales on vertical scaling. Paper presented at the annual meeting of the National Council on Measurement in Education, San Diego, CA.

Tong, Y., & Kolen, M. J. (2008). Maintenance of vertical scales. In annual meeting of the National Council on Measurement in Education, New York City.

van der Linden, W. J., & Glas, C. A. W. (eds.). (2010). Elements of Adaptive Testing. New York, NY: Springer.

von Davier, A. A., Carstensen, C. H., & von Davier, M. (2006). Linking competencies in educational settings and measuring growth. ETS Research Report Series, 2006(1), i–36. Retrieved from https://files.eric.ed.gov/fulltext/EJ1111406.pdf

Wainer, H. (Ed.). (2000). Computerized adaptive testing: A Primer, 2nd Edn. Mahwah, NJ: Lawrence Erlbaum Associates.

Wingersky, M. S., & Lord, F. M. (1983). An Investigation of Methods for Reducing Sampling Error in Certain IRT Procedures (ETS Research Reports Series No. RR-83-28-ONR). Princeton, NJ: Educational Testing Service.

Yen, W. M. (1986). The choice of scale for educational measurement: An IRT perspective. Journal of Educational Measurement, 23(4), 299–325.

Yen, W. M., & Burket, G. R. (1997). Comparison of item response theory and Thurstone methods of vertical scaling. Journal of Educational Measurement, 34(4), 293–313.