
The Story of the Three Standard Errors
One of my graduate school mentors once said in class that there are three standard errors that everyone in the assessment or I/O Psych field needs to know: mean, error, and estimate. They are quite distinct in concept and application but easily confused by someone with minimal training.
I’ve personally seen the standard error of the mean reported as the standard error of measurement, which is completely unacceptable.
So in this post, I’ll briefly describe each so that the differences are clear. In later posts, I’ll delve deeper into each of the standard errors.
Standard Error of the Mean
This is the standard error that you learned about in Introduction to Statistics back in your sophomore year of college/university. It is related to the Central Limit Theorem, the cornerstone of statistics. Its purpose is to provide an index of accuracy (or conversely, error) in a sample mean. Any sample drawn from a population will have an average, but these can vary. The standard error of the mean estimates the variation we might expect in these different means from different samples and is defined as
SEmean = SD/sqrt(n)
Where SD is the sample’s standard deviation and n is the number of observations in the sample. This can be used to create a confidence interval for the true population mean.
The most important thing to note, with respect to psychometrics, is that this has nothing to do with psychometrics. This is just general statistics. You could be weighing a bunch of hay bales and calculating their average; anything where you are making observations. It can be used, however, with assessment data.
For example, if you do not want to make every student in a country take a test, and instead sample 50,000 students, with a mean of 71 items correct with an SD of 12.3, then the SEM is 12.3/sqrt(50000) = 0.055. You can be 95% certain that the true population means then lies in the narrow range of 71 +- 0.055.
Click here to read more.
Standard Error of Measurement
More important in the world of assessment is the standard error of measurement. Its purpose is to provide an index of the accuracy of a person’s score on a test. That is a single person, rather than a group like with the standard error of the mean. It can be used in both the classical test theory perspective and item response theory perspective, though it is defined quite differently in both.
In classical test theory, it is defined as
SEM = SD*sqrt(1-r)
Where SD is the standard deviation of scores for everyone who took the test, and r is the reliability of the test. It can be interpreted as the standard deviation of scores that you would find if you had the person take the test over and over, with a fresh mind each time. A confidence interval with this is then interpreted as the band where you would expect the person’s true score on the test to fall.
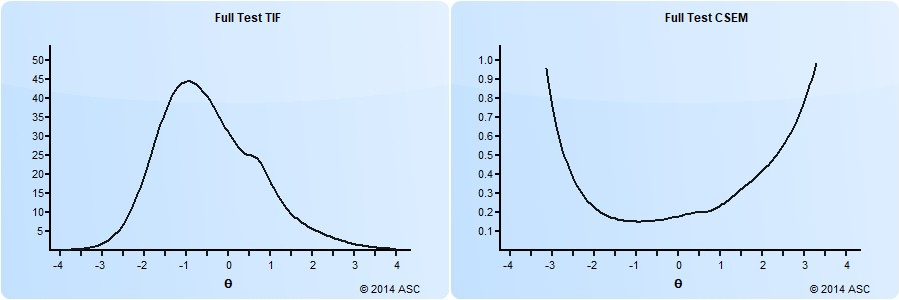
Item Response Theory conceptualizes the SEM as a continuous function across the range of student abilities. A test form will have more accuracy – less error – in a range of abilities where there are more items or items of higher quality. That is, a test with most items of middle difficulty will produce accurate scores in the middle of the range, but not measure students on the top or bottom very well. The example below is a test that has many items above the average examinee score (θ) of 0.0 so that any examinee with a score of less than 0.0 has a relatively inaccurate score, namely with an SEM greater than 0.50.
For a deeper discussion of SEM, click here.
Standard Error of the Estimate
Lastly, we have the standard error of the estimate. This is an estimate of the accuracy of a prediction that is made, usually in the paradigm of linear regression. Suppose we are using scores on a 40 item job knowledge test to predict job performance, and we have data on a sample of 1,000 job incumbents that took the test last year and have job performance ratings from this year on a measure that entails 20 items scored on a 5 point scale for a total of 100 points.
There might have been 86 incumbents that scored 30/40 on the test, and they will have a range of job performance, let’s say from 61 to 89. If a new person takes the test and scores 30/40, how would we predict their job performance?
The SEE is defined as
SEE = SDy*sqrt(1-r2)
Here, the r is the correlation of x and y, not reliability. Many statistical packages can estimate linear regression, SEE, and many other related statistics for you. In fact, Microsoft Excel comes with a free package to implement simple linear regression. Excel estimates the SEE as 4.69 in the example above, and the regression slope and intercept are 29.93 and 1.76, respectively
Given this, we can estimate the job performance of a person with a 30 test score to be 82.73. A 95% confidence interval for a candidate with a test score of 30 is then 82.71-(4.69*1.96) to 82.71+(4.69*1.96), or 73.52 to 91.90.
You can see how this might be useful in prediction situations. Suppose we wanted to be sure that we only hired people who are likely to have a job performance rating of 80 or better? Well, a cutscore of 30 on the test is therefore quite feasible.
OK, so now what?
Well, remember that these three standard errors are quite different and are not even in related situations. When you see a standard error requested – for example if you must report the standard error for an assessment – make sure you use the right one!
Nathan Thompson, PhD
Latest posts by Nathan Thompson, PhD (see all)
- What is a T score? - April 15, 2024
- Item Review Workflow for Exam Development - April 8, 2024
- Likert Scale Items - February 9, 2024