assessment-technology-improve-exams

Assessment is being drastically impacted by technology, as is much of education.  Just like learning is undergoing a sea-change with artificial intelligence, multimedia, gamification, and many more aspects, assessment is likewise being impacted.  This post discussed a few ways this is happening.

What is assessment technology?


10 Ways That Assessment Technology Can Improve Exams

Automated Item generation

Newer assessment platforms will include functionality for automated item generation.  There are two types: template-based and AI text generators from LLMs like ChatGPT.

Gamification

Low-stakes assessment like formative quizzes in eLearning platforms are ripe for this.  Students can earn points, not just in a sense of test scores, but perhaps something like earning coins in a video game, and gaining levels.  They might even have an avatar that can be equipped with cool gear that the student can win.

Simulations

psychometric training and workshopsIf you want to assess how somebody performs a task, it used to be that you had to fly them in.  For example, I used to work on ophthalmic exams where they would fly candidates into a clinic once a year, to do certain tasks while physicians were watching and grading.  Now, many professions offer simulations of performance tests.

Workflow management

Items are the basic building blocks of the assessment.  If they are not high quality, everything else is a moot point. There needs to be formal processes in place to develop and review test questions.  You should be using item banking software that helps you manage this process.

Linking

Linking and equating refer to the process of statistically determining comparable scores on different forms of an exam, including tracking a scale across years and completely different set of items.  If you have multiple test forms or track performance across time, you need this.  And IRT provides far superior methodologies.

Automated test assembly

The assembly of test forms – selecting items to match blueprints – can be incredibly laborious.  That’s why we have algorithms to do it for you.  Check out  TestAssembler.

Item/Distractor analysis
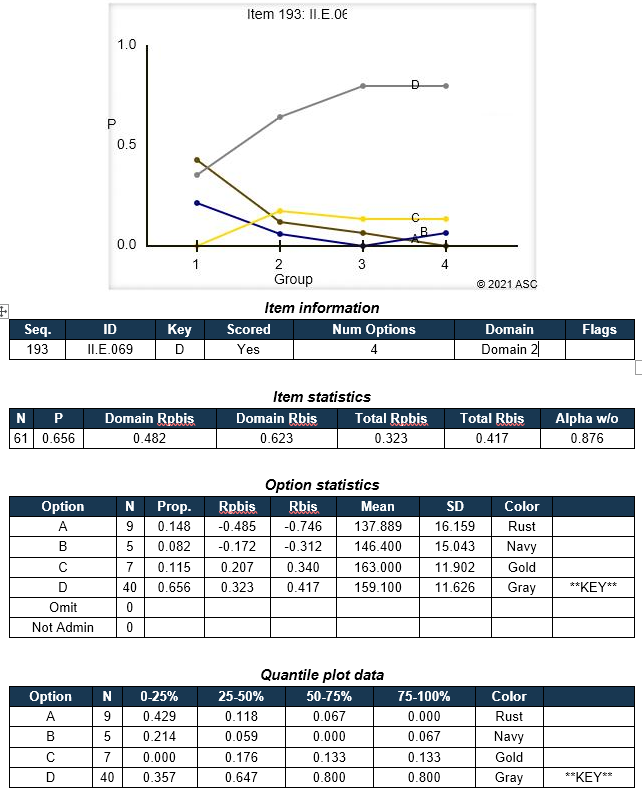
Iteman45-quantile-plotIf you are using items with selected responses (including multiple choice, multiple response, and Likert), a distractor/option analysis is essential to determine if those basic building blocks are indeed up to snuff.  Our reporting platform in  FastTest, as well as software like  Iteman  and  Xcalibre, is designed for this purpose.

Item response theory (IRT)

This is the modern paradigm for developing large-scale assessments.  Most important exams in the world over the past 40 years have used it, across all areas of assessment: licensure, certification, K12 education, postsecondary education, language, medicine, psychology, pre-employment… the trend is clear.  For good reason.  It will improve assessment.

Automated essay scoring

This technology is has become more widely available to improve assessment.  If your organization scores large volumes of essays, you should probably consider this.  Learn more about it here.  There was a Kaggle competition on it in the past.

Computerized adaptive testing (CAT)

Tests should be smart.  CAT makes them so.  Why waste vast amounts of examinee time on items that don’t contribute to a reliable score, and just discourage the examinees?  There are many other advantages too.

parcc ebsr items

The Partnership for Assessment of Readiness for College and Careers (PARCC) is a consortium of US States working together to develop educational assessments aligned with the Common Core State Standards.  This is a daunting task, and PARCC is doing an admirable job, especially with their focus on utilizing technology.  However, one of the new item types has a serious psychometric fault that deserves a caveat with regards to scoring.

The item type is an “Evidence-Based Selected-­Response” (PARCC EBSR) item format, commonly called a Part A/B item or Two-Part item.  The goal of this format is to delve deeper into student understanding, and award credit for deeper knowledge while minimizing the impact of guessing.  This is obviously an appropriate goal for assessment.  To do so, the item is presented as two parts to the student, where the first part asks a simple question and the second part asks for supporting evidence to their answer in Part A.  Students must answer Part A correctly to receive credit on Part B.  As described on the PARCC website:


In order to receive full credit for this item, students must choose two supporting facts that support the adjective chosen for Part A. Unlike tests in the past, students may not guess on Part A and receive credit; they will only receive credit for the details they’ve chosen to support Part A.


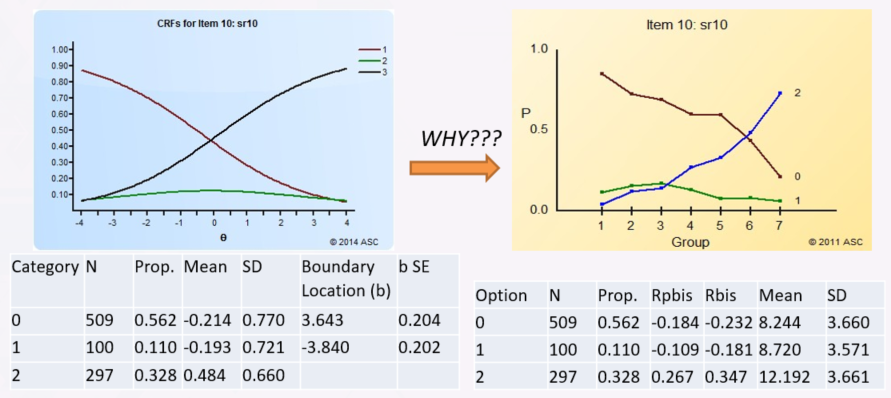
While this makes sense in theory, it leads to problem in data analysis, especially if using Item Response Theory (IRT). Obviously, this violates the fundamental assumption of IRT, local independence (items are not dependent on each other).  So when working with a client of mine, we decided to combine it into one multi-point question, which matches the theoretical approach PARCC EBSR items are taking.  The goal was to calibrate the item with Muraki’s generalized partial credit model (GPCM), which is typically used to analyze polytomous items in K12 assessment (learn more here).  The GPCM tries to order students based on the points they earn: 0 point students tend to have the lowest ability, 1 point students of moderate ability, and 2 point students are of the highest ability.  The polytomous category response functions (CRFs) then try to approximate those, and the model estimates thresholds, the points that are the line between a 0-point student and a 1-point student and 1 vs. 2.  This typically occurs to where the adjacent CRFs cross.

The first thing we noticed was that some point levels had very small sample sizes.  Suppose that Part A is 1 point and Part B is 1 point (select two evidence pieces but must get both).  Most students will get 0 points or 2 points.  Not many will receive 1: the only way to earn 1 point is to guess Part A but select no correct evidence or only select one evidence point.  This leads to calibration issues with the GPCM.

However, even when there was sufficient N at each level, we found that the GPCM had terrible fit statistics, meaning that the item was not performing according to the model described above.  So I ran Iteman, our classical analysis software, to obtain quantile plots that approximate the polytomous IRFs without imposing the GPCM modeling.  I found that in the 0-2 point items tend to have the issue where not many students get 1 point, and moreover the line for them is relatively flat.  The GPCM assumes that it is relatively bell-shaped.  So the GPCM is looking for where the drop-offs are in the bell shape, crossing with adjacent CRFs – the thresholds – and they aren’t there.  The GPCM would blow up, usually not even estimating thresholds in correct ordering.

PARCC EBSR Graphs

So I tried to think of this from a test development perspective.  How do students get 1 point on these PARCC EBSR items?  The only way to do so is to get Part A right but not Part B.  Given that Part B is the reason for Part A, this means this group is students who answer Part A correctly but don’t know the reason, which means they are guessing.  It is then no surprise that the data for 1-point students is in a flat line – it’s just like the c parameter in the 3PL.  So the GPCM will have an extremely tough time estimating threshold parameters.

From a psychometric perspective, point levels are supposed to represent different levels of ability.  A 1-point student should be higher ability than a 0-point student on this item, and a 2-point student of higher ability than a 1-point student.  This seems obvious and intuitive.  But this item, by definition, violates that first statement.  The only way to get 1 point is to guess the first part – and therefore not know the answer and are no different than the 0-point examinees whatsoever.  So of course the 1-point results look funky here.

The items were calibrated as two separate dichotomous items rather than one polytomous item, and the statistics turned out much better.  This still violates the IRT assumption but at least produces usable IRT parameters that can score students.  Nevertheless, I think the scoring of these items needs to be revisited so that the algorithm produces data which is able to be calibrated in IRT.  The entire goal of test items is to provide data points used to measure students; if the item is not providing usable data, then it is not worth using, no matter how good it seems in theory!