Leadership assessments are more than just tools; they are crucial to identifying and developing effective organizational leadership. Plenty of options exist for “leadership assessments,” from off-the-shelf tools costing $15 to the incredible bespoke, intense, and, sometimes, invasive assessments that use multiple psychologists and can cost upwards of $50,000. In this blog, I’ll provide a framework for leadership assessments with the right amount of measurement rigor that won’t break the bank or your candidates. I’ll focus on leadership assessments in the selection (i.e., hiring) context, although the information extends to assessments for leadership development.

The Role of Job Analysis in Leadership Assessments

In any selection context, it’s important to begin with a job analysis so you understand what you are trying to measure. In other words, what does “good” look like? We find that using historical information (e.g., job description, ONET data, industry information, etc.) followed by detailed discussions with subject matter experts within an organization appropriately balances efficiency and comprehensiveness in pinpointing the essential skills and tasks necessary for a leader to succeed.

Designing Robust Leadership Assessments

From the job analysis, we gather a list of the critical skills along with their importance ratings. With this information, we create a comprehensive leadership assessment incorporating several methodologies to evaluate potential leaders. These include:low-motivated-students-on-the-test

  Construct Validity: Utilizing psychometric tools that are rigorously tested and validated to measure specific leadership constructs effectively. For example, measuring a candidate’s ability to influence may involve assessments like the Hogan Insight Series and the Leadership Effectiveness Analysis, as they have proven their constructs with leadership samples over the past decades.

  Content Validity: Structured interviews reflect the competencies identified during the job analysis stage. These interviews are crafted to probe deep into the candidate’s experiences and skills in areas critical to the role.

  Criterion-Related Validity: The real test of an assessment’s value is its ability to predict actual job performance. Correlating assessment outcomes with real job performance metrics confirms the predictive validity of the assessment tools.

At People Strategies, we integrate these approaches to ensure our leadership assessments are not just theoretical but also practical and actionable.

Effective Reporting for Informed Decision-Making

Despite the complex underpinnings, the reporting of assessment results is simplified to aid quick and informed decision-making. Each leadership skill assessed is rated and integrated into a weighted fit score. This score reflects its importance as determined in the job analysis, providing a clear, quantifiable measure of a candidate’s suitability for the leadership role.

Conclusion

Effective leadership assessments are vital for nurturing and selecting the right leaders to meet an organization’s strategic goals. At People Strategies, we emphasize a scientific approach, integrating thorough validation processes to ensure that our assessments are accurate and deeply informative. This rigorous methodology allows us to deliver assessments that are both comprehensive in their analysis and practical in their application, ensuring that organizations can confidently make crucial leadership decisions.

About the author

David Dubin PhD - Leadership Assessments

David Dubin, PhD, is an international expert on HR assessment and founder of People Strategies.  With a doctorate in industrial-organizational psychology and more than a decade of experience at major firms like Aon and SHL, David can help you improve your pre-hire practices to maximize the value of your team.


One of my favorite quotes is from Mark Twain: “There is no such thing as a new idea. It is impossible. We simply take a lot of old ideas and put them into a sort of mental kaleidoscope.”  How can we construct a better innovation kaleidoscope for assessment?

We all attend conferences to get ideas from our colleagues in the assessment community on how to manage challenges. But ideas from across industries have been the source for some of the most radical innovations. Did you know that the inspiration for fast food drive-throughs was race car pit stops? Or that the idea for wine packaging came from egg cartons?

Most of the assessment conferences we have attended recently have been filled with sessions about artificial intelligence. AI is one of the most exciting developments to come along in our industry – as well as in other industries – in a long time. But many small- or moderate-sized organizations may feel it is out of reach for their organizations. Or they may be reluctant to adopt it for security or other concerns.

There are other worthwhile ideas that can be borrowed from other industries and adapted for use by small and moderate-sized assessment organizations. For instance, concepts from product development, design thinking, and lean manufacturing can be beneficial to assessment processes.

Agile Software Development

Many organizations use agile product methodologies for software development. While strict adherence to an agile methodology may not be appropriate for item development activities, there are pieces of the agile philosophy that might be helpful for item development processes. For instance, in the agile methodology, user stories are used to describe the end goal of a software feature from the standpoint of a customer or end user. In the same way, the user story concept could be used to delineate the intended construct responsibilities items must meet or how items are intended to be scored. This can help ensure that everyone involved in test development has a clear understanding of the measurement intent of the item from the onset.item review kanban

Another feature of agile development is the use of acceptance criteria. Acceptance criteria are predefined standards used to determine if user stories have been completed. In item development processes, acceptance criteria can be developed to set and communicate common standards to all involved in the item authoring process.

Agile development also uses a tool known as a Kanban Board to manage the process of software development by assigning tasks and moving development requests through various stages such as new, awaiting specs, in development, in QA, and user review. This approach can be applied the management of item development in assessment, as you see here from our Assess.ai platform.

Design Thinking and Innovation

Design thinking is a human-centered approach to innovation. At its core is empathy for customers and users. A key design thinking tool is the journey map, which is a visual representation of a process that individuals (e.g., customers or users) go through to achieve a goal. The purpose of creating a journey map is to identify pain points in the user experience and create better user experiences. Journey maps could potentially be used by assessment organizations to diagram the volunteer SME experience and identify potential improvements. Likewise, it could be used in the candidate application and registration process.

Lean Manufacturing

Lean manufacturing is a methodology aimed at reducing production times. A key technique within the lean methodology is value stream mapping (VSM). VSM is a way of visualizing both the flow of information and materials through a process as a means of identifying waste. Admittedly, I do not know a great deal about the intricacies of the technique, but it is most helpful to understand the underlying philosophy and intentions:

· To develop a mutual understanding between all stakeholders involved in the process;

· To eliminate process steps and tasks which do not add value to the process but may contribute to user frustration and to error.

The big question for innovation: Why?

A key question to ask when examining a process is ‘why.’ So often we proceed with processes year in and year out, keeping them the same, because ‘it’s the way we’ve always done them’ without ever questioning why, for so long that we have forgotten what the original answer to the question was. ‘Why’ is an immensely powerful and helpful question.

In addition to asking the ‘why’ question, a takeaway from value stream mapping and from journey mapping is visual representation. Being able to diagram or display the process is a fantastic way to develop a mutual understanding from all stakeholders involved in the process. So often we also concentrate on pursuing shiny new tools like AI that we neglect potential efficiencies in the underlying processes. Visually displaying processes can be extremely helpful in process improvement.

T scores

A T Score (sometimes hyphenated T-Score) is a common example of a scaled score in psychometrics and assessment.  A scaled score is simply a way to present scores in a more meaningful and easier-to-digest context, with the benefit of hiding the sometimes obtuse technicalities of psychometrics.  Therefore, a T Score is a standardized way that scores are presented to make them easier to understand.

What is a T Score?

A T score is a conversion of the standard normal distribution, aka Bell Curve.  The normal distribution places observations (of anything, not just test scores) on a scale that has a mean of 0.00 and a standard deviation of 1.00.  We simply convert this to have a mean of 50 and standard deviation of 10.  Doing so has two immediate benefits to most consumers:

  1. There are no negative scores; people generally do not like to receive a negative score!
  2. Scores are round numbers that generally range from 0 to 100, depending on whether 3, 4, or 5 standard deviations is the bound (usually 20 to 80); this somewhat fits with what most people expect from their school days, even though the numbers are entirely different.

The image below shows the normal distribution, labeled with the different scales for interpretation.

T score vs z score vs percentile

How to interpret a T score?

As you can see above, a T Score of 40 means that you are approximately the 16th percentile.   This is a low score, obviously, but a student will feel better than if they received a score if -1.  It is for the same reason that many educational assessments use other scaled scores.  The SAT has a scale of mean=500 SD=100 (T score x 10), so if you receive a score of 400 it again means that you are z=-1 or percentile of 16.

A 70 means that you are approximately the 98th percentile – so that it is actually quite high though students who are used to receiving 90s will feel like it is low!

Since there is a 1-to-1 mapping of T Score to the other rows, you can see that it does not actually provide any new information.  It is simply a conversion to round, positive numbers, that is easier to digest and less likely to upset someone that is unfamiliar with psychometrics.  My undergraduate professor who introduced me to psychometrics used the term “repackaging” to describe scaled scores.  Like if you take an object out of one box and put it in a different box, it looks different superficially, but the object itself and its meaning (e.g., weight) have not changed.

How do I calculate a T score?

Use this formula:

T = z*10 + 50

where  is the standard z-score on the normal distribution N(0,1).

Example of a T score

Suppose you have a z-score of -0.5.  If you put that into the formula, you get T = -0.5*10 + 50 = -5 + 50 = 45.  If you look at the graphic above, you can see how being half a standard deviation below the mean translates to a T score of 45.

Is a T Score like a t-test?

No.  Couldn’t be more unrelated.  Nothing like the t-test.

How do I implement with an assessment?

If you are using off-the-shelf psychological assessments, they will likely produce a T Score for you in the results.  If you want to utilize it for your own assessments, you need a world-class assessment platform like  FastTest  that has strong functionality for scoring methods and scaled scoring.  An example of this is below.  Here, we are utilizing item response theory for the raw score.

As with all scaled scoring, it is a good idea to provide an explanation to your examinees and stakeholders.

Scaled scores in FastTest

woman-taking-test

Item Review is the process of ensuring that newly-written test questions go through a rigorous peer review, to ensure that they are high quality and meet industry standards.

What is  an item review workflow?

Developing a high-quality item bank is an extremely involved process, and authoring of the items is just the first step.  Items need to go through a defined workflow, with multiple people providing item review.  For example, you might require all items to be reviewed by another content expert, a psychometrician, an editor, and a bias reviewer.  Each needs to give their input and pass the item along to the next in line.  You need to record the results of the review for posterity, as part of the concept of validity is that we have documentation to support the development of a test.

What to review?

You should first establish what you want reviewed.  Assessment organizations will often formalize the guidelines as an Item Writing Guide.  Here is the guide that Assessment Systems uses with out clients, but I also recommend checking out the NBME Item Writing Guide.  For an even deeper treatment, I recommend the book Developing and Validating Test Items by Haladyna and Rodriguez (2013).

Here are some aspects to consider for item review.

Content

Most importantly, other content experts should check the item’s content.  Is the correct answer actually correct?  Are all the distractors actually correct?  Does the stem provide all the necessary info?  You’d be surprised how many times such issues slip past even the best reviewers!

Psychometrics

Psychometricians will often review an item to confirm that it meets best practices and that there are no tip-offs.  A common one is that the correct answer is often longer (more words) than the distractors.  Some organizations avoid “all of the above” and other approaches.

Format

Formal editors are sometimes brought in to work on the language and format of the item.  A common mistake is to end the stem with a colon even though that does not follow basic grammatical rules of English.

Bias/Sensitivity

For high-stakes exams that are used on diverse populations, it is important to add this step.  You don’t want items that are biased against a subset of students.  This is not just racial; it can include other differentiations of students.  Years ago I worked on items for the US State of Alaska, which has some incredibly rural regions; we had to avoid concepts that many people take for granted, like roads or shopping malls!

How to implement an item review workflow

item review kanban

This is an example of how to implement the process in a professional-grade item banking platform.  Both of our platforms,  FastTest  and  Assess.ai, have powerful functionality to manage this process.  Admin users can define the stages and the required input, then manage the team members and flow of items.  Assess.ai is unique in the industry with its use of Kanban boards – recognized as the best UI for workflow management – for item review.

An additional step, often at the same time, is standard setting.  One of the most common approaches is called the modified-Angoff method, which requires you to obtain a difficulty rating from a team of experts for each item.  The Item Review interfaces excel in managing this process as well, saving you all the effort of manually managing that process!

CREATE WORKFLOW
Assess.ai item review submit options
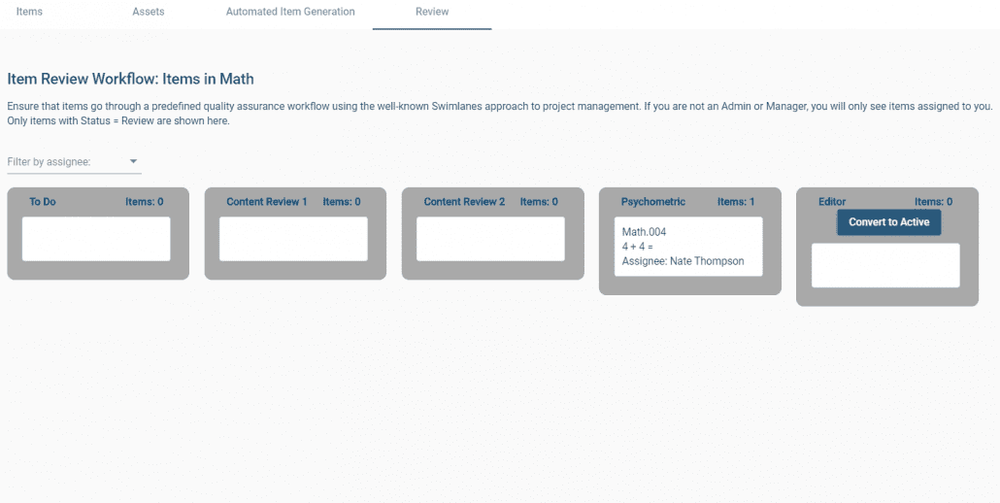
Specify your stages and how items can move between them

DEFINE YOUR REVIEW FIELDS
These are special item metadata fields that require input from multiple users

MOVE NEW ITEMS INTO THE WORKFLOW
Once an item is written, it is ready for review

ASSIGN ITEMS TO USERS
Assign the item in the UI, with the option to send an email

USERS PERFORM REVIEWS
They can read the item, interact as a student would, and then leave feedback and other metadata in the review fields; then push the item down the line

ADMINS EVALUATE/EXPORT THE RESULTS
Admins can evaluate the results and decide if an item needs revision, or if it can be considered released.


job-task-analysis

Job Task Analysis (JTA) is an essential step in designing a test to be used in the workforce, such as pre-employment or certification/licensure, by analyzing data on what is actually being done in the job.  Also known as Job Analysis or Role Delineation, job task analysis is important to design a test that is legally defensible and eligible for accreditation.  It usually involves a panel of subject matter experts to develop a survey, which you then deliver to professionals in your field to get quantitative data about what is most frequently done on the job and what is most critical/important.  This data can then be used for several important purposes.

Need help? Our experts can help you efficiently produce a job task analysis study for your certification, guide the process of item writing and standard setting, then publish and deliver the exam on our secure platform.


Reasons to do a Job Task Analysis

Job analysis is extremely important in the field of industrial/organizational psychology, hence the meme here from @iopsychmemes.  It’s not just limited to credentialing.

Job analysis I/O Psychology

Exam design

The most common reason is to get quantitative data that will help you design an exam.  By knowing what knowledge, skills, or abilities (KSAs), are most commonly used, you then know which deserve more questions on the test.  It can also help you with more complex design aspects, such as defining a practical exam with live patients.

Training curriculum

Similarly, that quantitative info can help design a curriculum and other training materials.  You will have data on what is most important or frequent.

Compensation analysis

You have a captive audience with the JTA survey.  Ask them other things that you want to know!  This is an excellent time to gather information about compensation.  I worked on a JTA in the past which asked about work location: clinic, hospital, private practice, or vendor/corporate.

Job descriptions

A good job analysis will help you write a job description for postings.  It will tell you the job responsibilities (common tasks), qualifications (required skills, abilities, and education), and other important aspects.  If you gather compensation data in the survey, that can be used to define the salary range of the open position.

Workforce planning

Important trends might become obvious when analyzing the data.  Are fewer people entering your profession, perhaps specific to a certain region or demographic?  Are they entering without certain skills?  Are there certain universities or training programs that are not performing well?  A JTA can help you discover such issues and then work with stakeholders to address them.  These are major potential problems for the profession.

IT IS MANDATORY

If you have a professional certification exam and want to get it accredited by a board such as NCCA or ANSI/ANAB/ISO, then you are REQUIRED to do some sort of job task analysis.


Why is a JTA so important for certification and licensure?  Validity.

The fundamental goal of psychometrics is validity, which is evidence that the interpretations we make from scores are actually true. In the case of certification and licensure exams, we are interpreting that someone who passes the test is qualified to work in that job role. So, the first thing we need to do is define exactly what is the job role, and to do it in a quantitative, scientific way. You can’t just have someone sit down in their basement and write up 17 bullet points as the exam blueprint.  That is a lawsuit waiting to happen.

There are other aspects that are essential as well, such as item writer training and standard setting studies.


The Methodology: Job Task Inventory

It’s not easy to develop a defensible certification exam, but the process of job task analysis (JTA) doesn’t require a Ph.D. in Psychometrics to understand. Here’s an overview of what to expect.

  1. Convene a panel of subject matter experts (SMEs), and provide a training on the JTA process.
  2. The SMEs then discuss the role of the certification in the profession, and establish high-level topics (domains) that the certification test should cover. Usually, there is 5-20. Sometimes there are subdomains, and occasionally sub-subdomains.
  3. The SME panel generates a list of job tasks that are assigned to domains; the list is reviewed for duplicates and other potential issues. These tasks have an action verb, a subject, and sometimes a qualifier. Examples: “Calibrate the lensometer,” “Take out the trash”, “Perform an equating study.”  There is a specific approach to help with the generation, called the critical incident technique.  With this, you ask the SMEs to describe a critical incident that happened on the job and what skills or knowledge led to success by the professional.  While this might not generate ideas for frequent yet simple tasks, it can help generate ideas for tasks that are rarer but very important.
  4. The final list is used to generate a survey, which is sent to a representative sample of professionals that actually work in the role
    The respondents take the survey, whereby they rate each task, usually on its importance and time spent (sometimes called criticality and frequency). Demographics are also gathered, which include age range, geographic region, work location (e.g., clinic vs hospital if medical), years of experience, educational level, and additional certifications.
  5. A psychometrician analyzes the results and creates a formal report, which is essential for validity documentation.  This report is sometimes considered confidential, sometimes published on the organization’s website for the benefit of the profession, and sometimes published in an abbreviated form.  It’s up to you.  For example, this site presents the final results, but then asks you to submit your email address for the full report.


Using JTA results to create test blueprints

Many corporations do a job analysis purely for in-house purposes, such as job descriptions and compensation.  This becomes important for large corporations where you might have thousands of people in the same job; it needs to be well-defined, with good training and appropriate compensation.

If you work for a credentialing organization (typically a non-profit, but sometimes the Training arm of a corporation… for example, Amazon Web Services has a division dedicated to certification exams), you will need to analyze the results of the JTA to develop exam blueprints.  We will discuss this process in more detail with another blog post.  But below is an example of how this will look, and here is a free spreadsheet to perform the calculations: Job Task Analysis to Test Blueprints.


Job Task Analysis Example

Suppose you are an expert widgetmaker in charge of the widgetmaker certification exam.  You hire a psychometrician to guide the organization through the test development process.  The psychometrician would start by holding a webinar or in-person meeting for a panel of SMEs to define the role and generate a list of tasks.  The group comes up with a list of 20 tasks, sorted into 4 content domains.  These are listed in a survey to current widgetmakers, who rate them on importance and frequency.  The psychometrician analyzes the data and presents a table like you see below.

We can see here that Task 14 is the most frequent, while Task 2 is the least frequent.  Task 7 is the most important while Task 17 is the least.  When you combine Importance and Frequency either by adding or multiplying, you get the weights on the right-hand columns.  If we sum these and divide by the total, we get the suggested blueprints in the green cells.


Job task analysis to test blueprints


Question and Test Interoperability® (QTI) is a set of standards around the format of import/export files for test questions in educational assessment and HR/credentialing exams.  This facilitates the movement of questions from one software platform to another, including item banking, test assembly, e-Learning, training, and exam delivery.  This serves two main purposes:

  1. Allows you to use multiple vendors more easily, such as one for item banking and another for exam delivery;
  2. Migrating to a new vendor, as you can export all your content from the old vendor then move into the new vendor easily.

In this blog post, we’ll discuss the significance of QTI and how it serves helps test sponsors in the world of certification, workforce, and educational assessment.

What is Question and Test Interoperability (QTI)?

QTI is a widely adopted standard that facilitates the exchange of assessment content and results between various learning platforms and assessment tools. Developed by the IMS Global Learning Consortium / 1EdTech, its goal is that assessments can be created, delivered, and evaluated consistently across different systems, paving the way for a more efficient and streamlined educational experience.  QTI is similar to SCORM, which is intended for learning content, while QTI is specific for assessment.

QTI uses an XML approach to content and markup, specifically modified for the situation of educational assessment, such as stems, answer, correct answers, and scoring information.  Version 2.x creates a zip file of all content, including a manifest file that lets the importing platform know what’s supposed to be coming in, with items then as separate XML files, and media files saved separately, sometimes into a subfolder.

Here is an example of the file arrangement inside the zip:

QTI files

Here is an example of what a test question would look like:

QTI example item


Why is QTI important?

Interoperability Across Platforms

QTI enables educators to create assessments on one platform and seamlessly transfer them to another. This cross-platform compatibility is crucial in today’s diverse educational technology landscape, where institutions often use a combination of learning management systems, assessment tools, and other applications.

Enhanced Efficiency

With QTI, the time-consuming process of manually transferring assessment content between systems is eliminated. This not only saves valuable time for educators but also ensures that the integrity of the assessment is maintained throughout the transfer process.

Adaptability to Diverse Assessment Types

QTI supports a wide range of question types, including multiple-choice, true/false, short answer, and more. This adaptability allows educators to create diverse and engaging assessments that cater to different learning styles and subject matter.

Data Standardization

The standardization of data formats within QTI ensures that assessment results are consistent and easily interpretable. This standardization not only facilitates a smoother exchange of information but also enables educators to gain valuable insights into student performance across various assessments.

Facilitating Accessibility

QTI is designed to support accessibility standards, making assessments more inclusive for all students, including those with disabilities. By adhering to accessibility guidelines, educational institutions can ensure that assessments are a fair and effective means of evaluating student knowledge.


How to Use QTI

Creating Assessments

qti specifications computer

QTI allows educators to author assessments in a standardized format that can be easily transferred between different platforms. When creating assessments, users adhere to the specification, ensuring compatibility and consistency.

Importing and Exporting Assessments

Educational institutions often use multiple learning management systems and assessment tools. QTI simplifies the process of transferring assessments between different platforms, eliminating the need for manual adjustments and reducing the risk of data corruption.

Adhering to QTI Specifications

To fully leverage the benefits of QTI, users must adhere to its specifications when creating and implementing assessments. Understanding the QTI schema and guidelines is essential for ensuring that assessments are interoperable across various systems.  This is dependent on the vendor you select.  Note that there have been different sets of QTI standards that have evolved over the years, and some vendors have slightly modified their own format!


Examples of QTI Applications

Online Testing Platforms

QTI is widely used in online testing platforms to facilitate the seamless transfer of assessments. Whether transitioning between different learning management systems or integrating third-party assessment tools, it ensures a smooth and standardized process.

Learning Management Systems (LMS)

Educational institutions often employ different LMS platforms. QTI allows educators to create assessments in one LMS and seamlessly transfer them to another, ensuring continuity and consistency in the assessment process.

Assessment Authoring Tools

QTI is integrated into various assessment authoring tools, enabling educators to create assessments in a standardized format. This integration ensures that assessments can be easily shared and used across different educational platforms


Resources for Implementation

IMS Global Learning Consortium

The official website of the IMS Global Learning Consortium provides comprehensive documentation, specifications, and updates related to QTI. Educators and developers can access valuable resources to understand and implement QTI effectively.

QTI-Compatible Platforms and Tools

Many learning platforms and assessment tools explicitly support these specifications. Exploring and adopting compatible solutions simplifies the implementation process and ensures a seamless experience for both educators and students.  Our FastTest platform provides support for QTI.

Community Forums and Support Groups

Engaging with the educational technology community through forums and support groups allows users to share experiences, seek advice, and stay updated on best practices for QTI implementation.  See this thread in Moodle forums, for example.

Wikipedia

Wikipedia has an overview of the topic.


Conclusion

In a world where educational technology is advancing rapidly, the Question and Test Interoperability specification stands out as a crucial standard for achieving interoperability in assessment tools, fostering a more efficient, accessible, and adaptable educational environment.. By understanding what QTI is, how to use it, exploring real-world examples, and tapping into valuable resources, educators can navigate the educational landscape more effectively, ensuring a streamlined and consistent e-Assessment experience for students and instructors alike.

Iteman45-quantile-plot

Classical Test Theory (CTT) is a psychometric approach to analyzing, improving, scoring, and validating assessments.  It is based on relatively simple concepts, such as averages, proportions, and correlations.  One of the most frequently used aspects is item statistics, which provide insight into how an individual test question is performing.  Is it too easy, too hard, too confusing, miskeyed, or potentially another issue?  Item statistics are what tell you these things.

What are classical test theory item statistics?

They are indices of how a test item, or components of it, is performing.  Items can be hard vs easy, strong vs weak, and other important aspects.  Below is the output from the Iteman report in our FastTest online assessment platform, showing an English vocabulary item with real student data.  How do we interpret this?

FastTest Iteman Psychometric Analysis

Interpreting Classical Test Theory Item Statistics: Item Difficulty

The P value (Multiple Choice)

The P value is the classical test theory index of difficulty, and is the proportion of examinees that answered an item correctly (or in the keyed direction). It ranges from 0.0 to 1.0. A high value means that the item is easy, and a low value means that the item is difficult.  There are no hard and fast rules because interpretation can vary widely for different situations.  For example, a test given at the beginning of the school year would be expected to have low statistics since the students have not yet been taught the material.  On the other hand, a professional certification exam, where someone can not even sit unless they have 3 years of experience and a relevant degree, might have all items appear easy even though they are quite advanced topics!  Here are some general guidelines”

    0.95-1.0 = Too easy (not doing much good to differentiate examinees, which is really the purpose of assessment)

    0.60-0.95 = Typical

    0.40-0.60 = Hard

    <0.40 = Too hard (consider that a 4 option multiple choice has a 25% chance of pure guessing)

With Iteman, you can set bounds to automatically flag items.  The minimum P value bound represents what you consider the cut point for an item being too difficult. For a relatively easy test, you might specify 0.50 as a minimum, which means that 50% of the examinees have answered the item correctly.

For a test where we expect examinees to perform poorly, the minimum might be lowered to 0.4 or even 0.3. The minimum should take into account the possibility of guessing; if the item is multiple-choice with four options, there is a 25% chance of randomly guessing the answer, so the minimum should probably not be 0.20.  The maximum P value represents the cut point for what you consider to be an item that is too easy. The primary consideration here is that if an item is so easy that nearly everyone gets it correct, it is not providing much information about the examinees.

In fact, items with a P of 0.95 or higher typically have very poor point-biserial correlations.

The Item Mean (Polytomous)

This refers to an item that is scored with 2 or more point levels, like an essay scored on a 0-4 point rubric or a Likert-type item that is “Rate on a scale of 1 to 5.”

  • 1=Strongly Disagree
  • 2=Disagree
  • 3=Neutral
  • 4=Agree
  • 5=Strongly Agree

The item mean is the average of the item responses converted to numeric values across all examinees. The range of the item mean is dependent on the number of categories and whether the item responses begin at 0. The interpretation of the item mean depends on the type of item (rating scale or partial credit). A good rating scale item will have an item mean close to ½ of the maximum, as this means that on average, examinees are not endorsing categories near the extremes of the continuum.

You will have to adjust for your own situation, but here is an example for the 5-point Likert-style item.

1-2 is very low; people disagree fairly strongly on average

2-3 is low to neutral; people tend to disagree on average

3-4 is neutral to high; people tend to agree on average

4-5 is very high; people agree fairly strongly on average

Iteman also provides flagging bounds for this statistic.  The minimum item mean bound represents what you consider the cut point for the item mean being too low.  The maximum item mean bound represents what you consider the cut point for the item mean being too high.

The number of categories for the items must be considered when setting the bounds of the minimum/maximum values. This is important as all items of a certain type (e.g., 3-category) might be flagged.

Interpreting Classical Test Theory Item Statistics: Item Discrimination

Multiple-Choice Items

The Pearson point-biserial correlation (r-pbis) is a classical test theory measure of the discrimination or differentiating strength, of the item. It ranges from −1.0 to 1.0 and is a correlation of item scores and total raw scores.  If you consider a scored data matrix (multiple-choice items converted to 0/1 data), this would be the correlation between the item column and a column that is the sum of all item columns for each row (a person’s score).

A good item is able to differentiate between examinees of high and low ability yet have a higher point-biserial, but rarely above 0.50. A negative point-biserial is indicative of a very poor item because it means that the high-ability examinees are answering incorrectly, while the low examinees are answering it correctly, which of course would be bizarre, and therefore typically indicates that the specified correct answer is actually wrong. A point-biserial of 0.0 provides no differentiation between low-scoring and high-scoring examinees, essentially random “noise.”  Here are some general guidelines on interpretation.  Note that these assume a decent sample size; if you only have a small number of examinees, many item statistics will be flagged!

0.20+ = Good item; smarter examinees tend to get the item correct

0.10-0.20 = OK item; but probably review it

0.0-0.10 = Marginal item quality; should probably be revised or replaced

<0.0 = Terrible item; replace it

***Major red flag is if the correct answer has a negative Rpbis and a distractor has a positive Rpbis

The minimum item-total correlation bound represents the lowest discrimination you are willing to accept. This is typically a small positive number, like 0.10 or 0.20. If your sample size is small, it could possibly be reduced.  The maximum item-total correlation bound is almost always 1.0, because it is typically desired that the r-pbis be as high as possible.

The biserial correlation is also a measure of the discrimination or differentiating strength, of the item. It ranges from −1.0 to 1.0. The biserial correlation is computed between the item and total score as if the item was a continuous measure of the trait. Since the biserial is an estimate of Pearson’s r it will be larger in absolute magnitude than the corresponding point-biserial.

The biserial makes the stricter assumption that the score distribution is normal. The biserial correlation is not recommended for traits where the score distribution is known to be non-normal (e.g., pathology).

Polytomous Items

The Pearson’s r correlation is the product-moment correlation between the item responses (as numeric values) and total score. It ranges from −1.0 to 1.0. The r correlation indexes the linear relationship between item score and total score and assumes that the item responses for an item form a continuous variable. The r correlation and the r-pbis are equivalent for a 2-category item, so guidelines for interpretation remain unchanged.

The minimum item-total correlation bound represents the lowest discrimination you are willing to accept. Since the typical r correlation (0.5) will be larger than the typical rpbis (0.3) correlation, you may wish to set the lower bound higher for a test with polytomous items (0.2 to 0.3). If your sample size is small, it could possibly be reduced.  The maximum item-total correlation bound is almost always 1.0, because it is typically desired that the r-pbis be as high as possible.

The eta coefficient is an additional index of discrimination computed using an analysis of variance with the item response as the independent variable and total score as the dependent variable. The eta coefficient is the ratio of the between-groups sum of squares to the total sum of squares and has a range of 0 to 1. The eta coefficient does not assume that the item responses are continuous and also does not assume a linear relationship between the item response and total score.

As a result, the eta coefficient will always be equal or greater than Pearson’s r. Note that the biserial correlation will be reported if the item has only 2 categories.

Coefficient cronbachs alhpa interpretation

Coefficient alpha reliability, sometimes called Cronbach’s alpha, is a statistical index that is used to evaluate the internal consistency or reliability of an assessment. That is, it quantifies how consistent we can expect scores to be, by analyzing the item statistics. A high value indicates that the test is of high reliability, and a low value indicates low reliability.  This is one of the most fundamental concepts in psychometrics, and alpha is arguably the most common index.

What is coefficient alpha, aka Cronbach’s alpha?

The classic reference to alpha is Cronbach (1954). He defines it as:

coefficient alpha

where k is the number of items, sigma-i is variance of item i, and sigma-X is total score variance.

Kuder-Richardson 20

While Cronbach tends to get the credit, to the point that the index is often called “Cronbach’s Alpha” he really did not invent it. Kuder and Richardson (1927) suggested the following equation to estimate the reliability of a test with dichotomous (right/wrong) items.

kr 20 reliability

Note that it is the same as Cronbach’s equation, except that he replaced the binomial variance pq with the more general notation of variance (sigma). This just means that you can use Cronbach’s equation on polytomous data such as Likert rating scales. In the case of dichotomous data such as multiple choice items, Cronbach’s alpha and KR-20 are the exact same.

Additionally, Cyril Hoyt defined reliability in an equivalent approach using ANOVA in 1941, a decade before Cronbach’s paper.

How to interpret coefficient alpha

In general, alpha will range from 0.0 (random number generator) to 1.0 (perfect measurement). However, in rare cases, it can go below 0.0, such as if the test is very short or if there is a lot of missing data (sparse matrix). This, in fact, is one of the reasons NOT to use alpha in some cases. If you are dealing with linear-on-the-fly tests (LOFT), computerized adaptive tests (CAT), or a set of overlapping linear forms for equating (non-equivalent anchor test, or NEAT design), then you will likely have a large proportion of sparseness in the data matrix and alpha will be very low or negative. In such cases, item response theory provides a much more effective way of evaluating the test.

What is “perfect measurement?”  Well, imagine using a ruler to measure a piece of paper.  If it is American-sized, that piece of paper is always going to be 8.5 inches wide, no matter how many times you measure it with the ruler.  A bathroom scale is slightly less reliability; You might step on it, see 190.2 pounds, then step off and on again, and see 190.4 pounds.  This is a good example of how we often accept unreliability in measurement.

Of course, we never have this level of accuracy in the world of psychoeducational measurement.  Even a well-made test is something where a student might get 92% today and 89% tomorrow (assuming we could wipe their brain of memory of the exact questions).

Reliability can also be interpreted as the ratio of true score variance to total score variance. That is, all test score distributions have a total variance, which consist of variance due to the construct of interest (i.e., smart students do well and poor students do poorly), but also some error variance (random error, kids not paying attention to a question, second dimension in the test… could be many things.

What is a good value of coefficient alpha?

As psychometricians love to say, “it depends.” The rule of thumb that you generally hear is that a value of 0.70 is good and below 0.70 is bad, but that is terrible advice. A higher value indeed indicates higher reliability, but you don’t always need high reliability. A test to certify surgeons, of course, deserves all the items it needs to make it quite reliable. Anything below 0.90 would be horrible. However, the survey you take from a car dealership will likely have the statistical results analyzed, and a reliability of 0.60 isn’t going to be the end of the world; it will still provide much better information than not doing a survey at all!

Here’s a general depiction of how to evaluate levels of coefficient alpha.

Coefficient cronbachs alhpa interpretation

Using Alpha: The classical standard error of measurement

Coefficient alpha is also often used to calculate the classical standard error of measurement (SEM), which provides a related method of interpreting the quality of a test and the precision of its scores. The SEM can be interpreted as the standard deviation of scores that you would expect if a person took the test many times, with their brain wiped clean of the memory each time. If the test is reliable, you’d expect them to get almost the same score each time, meaning that SEM would be small.

   SEM=SD*sqrt(1-r)

Note that SEM is a direct function of alpha, so that if alpha is 0.99, SEM will be small, and if alpha is 0.1, then SEM will be very large.

Coefficient Alpha and Unidimensionality

It can also be interpreted as a measure of unidimensionality. If all items are measuring the same construct, then scores on them will align, and the value of alpha will be high. If there are multiple constructs, alpha will be reduced, even if the items are still high quality. For example, if you were to analyze data from a Big Five personality assessment with all five domains at once, alpha would be quite low. Yet if you took the same data and calculated alpha separately on each domain, it would likely be quite high.

How to calculate the index

Because the calculation of coefficient alpha reliability is so simple, it can be done quite easily if you need to calculate it from scratch, such as using formulas in Microsoft Excel. However, any decent assessment platform or psychometric software will produce it for you as a matter of course. It is one of the most important statistics in psychometrics.

Cautions on Overuse

Because alpha is just so convenient – boiling down the complex concept of test quality and accuracy to a single easy-to-read number – it is overused and over-relied upon. There are papers out in the literature that describe the cautions in detail; here is a classic reference.

One important consideration is the over-simplification of precision with coefficient alpha, and the classical standard error of measurement, when juxtaposed to the concept of conditional standard error of measurement from item response theory. This refers to the fact that most traditional tests have a lot of items of middle difficulty, which maximizes alpha. This measures students of middle ability quite well. However, if there are no difficult items on a test, it will do nothing to differentiate amongst the top students. Therefore, that test would have a high overall alpha, but have virtually no precision for the top students. In an extreme example, they’d all score 100%.

Also, alpha will completely fall apart when you calculate it on sparse matrices, because the total score variance is artifactually reduced.

Summary

In conclusion, coefficient alpha is one of the most important statistics in psychometrics, and for good reason. It is quite useful in many cases, and easy enough to interpret that you can discuss it with test content developers and other non-psychometricians. However, there are cases where you should be cautious about its use, and some cases where it completely falls apart. In those situations, item response theory is highly recommended.

Juggling-statistics

What is the difference between the terms dichotomous and polytomous in psychometrics?  Well, these terms represent two subcategories within item response theory.  Item response theory (IRT) is the dominant psychometric paradigm for constructing, scoring and analyzing assessments.  Virtually all large-scale assessments utilize IRT because of its well-documented advantages.  In many cases, however, it is referred to as a single way of analyzing data.  But, IRT is actually a family of fast-growing models.  The models operate quite differently based on whether the test questions are scored right/wrong or yes/no (dichotomous), vs. complex items like an essay that might be scored on a rubric of 0 to 6 points (polytomous).  This post will provide a description of the differences and when to use one or the other.


Ready to use IRT?  Download Xcalibre for free


Dichotomous IRT Models

Dichotomous IRT models are those with two possible item scores.  Note that I say “item scores” and not “item responses” – the most common example of a dichotomous item is multiple choice, which typically has 4 to 5 options, but only two possible scores (correct/incorrect).  

True/False or Yes/No items are also obvious examples and are more likely to appear in surveys or inventories, as opposed to the ubiquity of the multiple-choice item in achievement/aptitude testing. Other item types that can be dichotomous are Scored Short Answer and Multiple Response (all or nothing scoring).  

What models are dichotomous?

The three most common dichotomous models are the 1PL/Rasch, the 2PL, and the 3PL.  Which one to use depends on the type of data you have, as well as your doctrine of course.  A great example is Scored Short Answer items: there should be no effect of guessing on such an item, so the 2PL is a logical choice.  Here is a broad overgeneralization:

  • 1PL/Rasch: Uses only the difficulty (b) parameter and does not take into account guessing effects or the possibility that some items might be more discriminating than others; however, can be useful with small samples and other situations
  • 2PL: Uses difficulty (b) and discrimination (a) parameters, but no guessing (c); relevant for the many types of assessment where there is no guessing
  • 3PL: Uses all three parameters, typically relevant for achievement/aptitude testing.

What do dichotomous models look like?

Dichotomous models, graphically, will have one S-shaped curve with a positive slope, as seen here.  This model that the probability of responding in the keyed direction increases with higher levels of the trait or ability.  

item response function

Technically, there is also a line for the probability of an incorrect response, which goes down, but this is obviously the 1-P complement, so it is rarely drawn in graphs.  It is, however, used in scoring algorithms (check out this white paper).

In the example, a student with theta = -3 has about a 0.28 chance of responding correctly, while theta = 0 has about 0.60 and theta = 1 has about 0.90.

Polytomous IRT Models

Polytomous models are for items that have more than two possible scores.  The most common examples are Likert-type items (Rate on a scale of 1 to 5) and partial credit items (score on an Essay might be 0 to 5 points). IRT models typically assume that the item scores are integers.

What models are polytomous?

Unsurprisingly, the most common polytomous models use names like rating scale and partial credit.

  • Rating Scale Model (Andrich, 1978)
  • Partial Credit Model (Masters, 1982)
  • Generalized Rating Scale Model (Muraki, 1990)
  • Generalized Partial Credit Model (Muraki, 1992)
  • Graded Response Model (Samejima, 1972)
  • Nominal Response Model (Bock, 1972)

What do polytomous models look like?

Polytomous models have a line that dictates each possible response.  The line for the highest point value is typically S-shaped like a dichotomous curve.  The line for the lowest point value is typically sloped down like the 1-P dichotomous curve.  Point values in the middle typically have a bell-shaped curve. The example is for an Essay that scored 0 to 5 points.  Only students with theta >2 are likely to get the full points (blue), while students 1<theta<2 are likely to receive 4 points (green).

I’ve seen “polychotomous.”  What does that mean?

It means the same as polytomous.  

How is IRT used in our platform?

We use it to support the test development cycle, including form assembly, scoring, and adaptive testing.  You can learn more on this page.

How can I analyze my tests with IRT?

You need specially designed software, like Xcalibre.  Classical test theory is so simple that you can do it with Excel functions.

Recommended Readings

Item Response Theory for Psychologists by Embretson and Riese (2000).  

group working on meta-analysis

Meta-analysis is a research process of collating data from multiple independent but similar scientific studies in order to identify common trends and findings by means of statistical methods. To put it simply, it is a method where you can accumulate all of your research findings and analyze them statistically. It is often used in psychometrics and industrial-organizational psychology to help validate assessments. Meta-analysis not only serves as a summary of a research question but also provides a quantitative evaluation of the relationship between two variables or the effectiveness of an experiment. It can also work for examining theoretical assumptions that compete with each other.

Background of Meta-Analysis

An American statistician and researcher, Gene Glass, devised the term ‘meta-analysis’ in 1976. He called so the statistical analysis of a large amount of data from individual studies in order to integrate the findings. Medical researchers began employing meta-analysis a few years later. One of the first influential applications of this method was when Elwood and Cochrane used meta-analysis to examine the effect of aspirin on reducing recurrences of heart attacks.

meta-analysis-studies

Purpose of Meta-Analysis

In general, meta-analysis is aimed at two things:

  • to establish whether a study has an effect and to determine whether it is positive or negative,
  • to analyze the results of previously conducted studies to find out common trends.

Performing Meta-Analysis

Even though there could be various ways of conducting meta-analysis depending on the research purpose and field, there are eight major steps:

  1. Set a research question and propose a hypothesis
  2. Conduct a systematic review of the relevant studies
  3. Extract data from the studies to include into the meta-analysis considering sample sizes and data variability measures for intervention and control groups (the control group is under observation whilst the intervention group is under experiment)
  4. Calculate summary measures, called effect sizes (the difference in average values between intervention and control groups), and standardize
    estimates if necessary for making comparisons between the groups
  5. Choose a meta-analytical method: quantitative (traditional univariate meta-analysis, meta-regression, meta-analytic structural equation modeling) or qualitative
  6. Pick up the software depending on the complexity of the methods used and the dataset (e.g. templates for Microsoft Excel, Stata, SPSS, SAS, R, Comprehensive Meta-Analysis, RevMan), and code the effect sizes
  7. Do analyses by employing an appropriate model for comparing effect sizes using fixed effects (assumes that all observations share a common mean effect size) or random effects (assumes heterogeneity and allows for a variation of the true effect sizes across observations)
  8. Synthesize results and report them

Prior to making any conclusions and reporting results, it would be helpful to use the checklist suggested by DeSimone et al. (2021) to ensure that all crucial aspects of the meta-analysis have been addressed in your study.

Meta-Analysis in Assessment & Psychometrics: Test Validation & Validity Generalization

Due to its versatility, meta-analysis is used in various fields of research, in particular as a test validation strategy in psychology and psychometrics. The most common situation to apply meta-analysis is validating the use of tests in workplace in the field of personnel psychology and pre-employment testing. The classic example of such application is the work done by Schmidt and Hunter (1998) who analyzed 85 years of research on what best predicts job performance. This is one of the most important articles in that topic. It has been recently updated by Sackett et al. (2021) with slightly different results.

How is meta-analysis applied to such a situation?  Well, start be reconceptualizing a “sample” as a set of studies, not a set of people. So let’s say we find 100 studies that use pre-employment tests to select examinees by predicting job performance (obviously, there are far more). Because most studies use more than one test, there might be 77 that use a general cognitive ability test, 63 that use a conscientiousness assessment, 24 that use a situational judgment test, etc. We look at the correlation coefficients reported for those first 77 studies and find that the average is 0.51, while the average correlation for conscientiousness is 0.44 and for SJTs is 0.39. You can see how this is extremely useful in a practical sense, as a practitioner that might be tasked with selecting an assessment battery!

Meta-analysis studies will often go further and clean up the results, by tossing studies with poor methodology or skewed samples, and applying corrections for things like range restriction and unreliability. This enhances the validity of the overall results. To see such an example, visit the Sackett et al. (2021) article.

Such research has led to the concept of validity generalization. This suggests that if a test has been validated for many uses, or similar uses, you can consider it validated for your particular use without having to do a validation study. For example, if you are selecting clerical workers and you can see that there are literally hundreds of studies which show that numeracy or quantitative tests will predict job performance, there is no need for you to do ANOTHER study. If challenged, you can just point to the hundreds of studies already done. Obviously, this is a reasonable argument, but you should not take it too far, i.e., generalize too much.

Conclusion

As you might have understood so far, conducting meta-analysis is not a piece of cake. However, it is very efficient when the researcher intends to evaluate effects in diverse participants, set another hypothesis creating a precedence for future research studies, demonstrate statistical significance or surmount the issue of a small sample size in research.

References

Borenstein, M., Hedges, L. V., Higgins, J. P., & Rothstein, H. R. (2021). Introduction to meta-analysis. John Wiley & Sons.

DeSimone, J. A., Brannick, M. T., O’Boyle, E. H., & Ryu, J. W. (2021). Recommendations for reviewing meta-analyses in organizational research. Organizational Research Methods24(4), 694-717.

Field, A. P., & Gillett, R. (2010). How to do a meta‐analysis. British Journal of Mathematical and Statistical Psychology63(3), 665-694.

Glass, G. V. (1976). Primary, secondary, and meta-analysis of research. Educational researcher5(10), 3-8.

Glass, G. V., McGaw, B., & Smith, M. L. (1981). Meta-analysis in social research. Sage Publications.

Gurevitch, J., Koricheva, J., Nakagawa, S., & Stewart, G. (2018). Meta-analysis and the science of research synthesis. Nature555(7695), 175-182.

Hansen, C., Steinmetz, H., & Block, J. (2022). How to conduct a meta-analysis in eight steps: A practical guide. Management Review Quarterly72(1), 1-19.

Hedges, L. V., & Olkin, I. (1985). Statistical methods for meta-analysis. Academic Press.

Hunter, J. E., Schmidt, F. L., & Jackson, G. B. (1982). Meta-analysis: Cumulating research findings across studies. Sage Publications.

Hunter, J. E., & Schmidt, F. L. (2004). Methods of meta-analysis: Correcting error and bias in research findings. Sage.

Peto, R., & Parish, S. (1980). Aspirin after myocardial infarction. Lancet1(8179), 1172-1173.

Sackett, P. R., Zhang, C., Berry, C. M., & Lievens, F. (2021). Revisiting meta-analytic estimates of validity in personnel selection: Addressing systematic overcorrection for restriction of range. Journal of Applied Psychology.

Schmidt, F. L., & Hunter, J. E. (1998). The validity and utility of selection methods in personnel psychology: Practical and theoretical implications of 85 years of research findings. Psychological bulletin124(2), 262.