standard-setting-study

A standard setting study is a formal, quantitative process for establishing a performance standard on an exam, such as what score is “proficient” or “passing.”  This is typically manifested as a cutscore which is then used for making decisions about people: hire them, pass them, accept them into university, etc.  Because it is used for such important decisions, a lot of work goes into standard setting, using methods based on scientific research.

What is NOT standard setting?

In the assessment world, there are actually three uses of the word standard:

  1. A formal definition of the content that is being tested, such as the Common Core State Standards in the USA.  
  2. A formalized process for delivering exams, as seen in the phrase “standardized testing.”
  3. A benchmark for performance, like we are discussing here.

For this reason, I prefer the term cutscore study, but the phrase standard setting is used more often.  

How is a standard setting study used?

As part of a comprehensive test development cycle, after item authoring, item review, and test form assembly, a cutscore or passing score will often be set to determine what level of performance qualified as “pass” or a similar classification.  This cannot be done arbitrarily, such as setting it at 70% because that’s what you saw when you were in school.  That is a legal landmine!  To be legally defensible and eligible for Accreditation of a Certification Program, it must be done using one of several standard-setting approaches from the psychometric literature.  So, if your organization is classifying examinees into Pass/Fail, Hire/NotHire, Basic/Proficient/Advanced, or any other groups, you most likely need a standard setting study.  This is NOT limited to certification, although it is often discussed in that pass/fail context.

What are some methods of a standard setting study?

There have been many methods suggested in the scientific literature of psychometrics.  They are often delineated into examinee-centered and item-centered approaches.  Angoff and Bookmark are designed around evaluating items, while Contrasting Groups and Borderline Groups are designed around evaluating the distributions of actual examinee scores.  The Bookmark approach is sort of both types, however, because it uses examinee performance on the items as the object of interest.

Angoff

Modified Angoff analysis

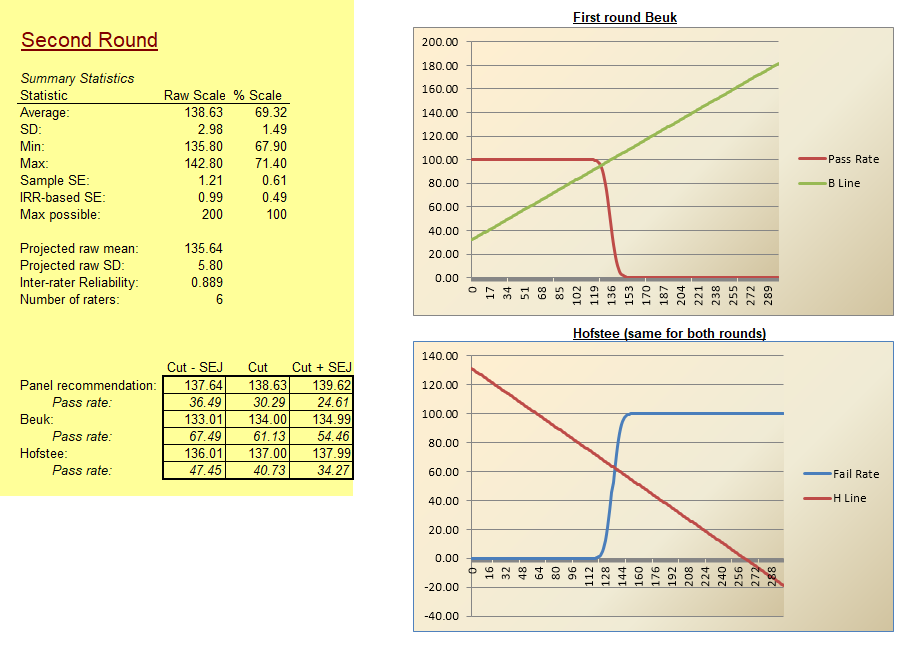
In an Angoff study, a panel of subject matter experts rates each item, estimating the percentage of minimally competent candidates that would answer each item correctly.  If we take the average of all raters, this then translates into the average percentage-correct score that the raters expect from a minimally competent candidate – a very compelling argument for a cutscore to pass competent examinees!  It is often done in tandem with the Beuk Compromise.  The Angoff method does not require actual examinee data, though the Beuk does.

Bookmark

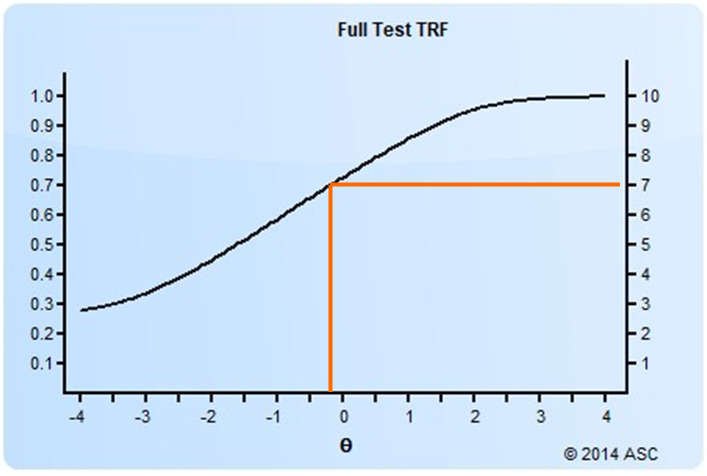
The bookmark method orders the items in a test form in ascending difficulty, and a panel of experts reads through and places a “bookmark” in the book where they think a cutscore should be.  Obviously, this requires enough real data to calibrate item difficulty, usually using item response theory, which requires several hundred examinees.

Contrasting Groups

contrasting groups cutscore

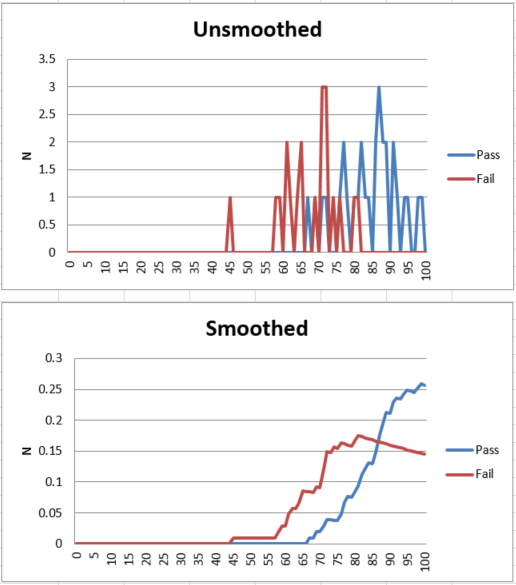
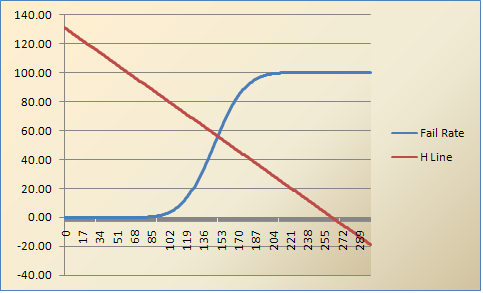
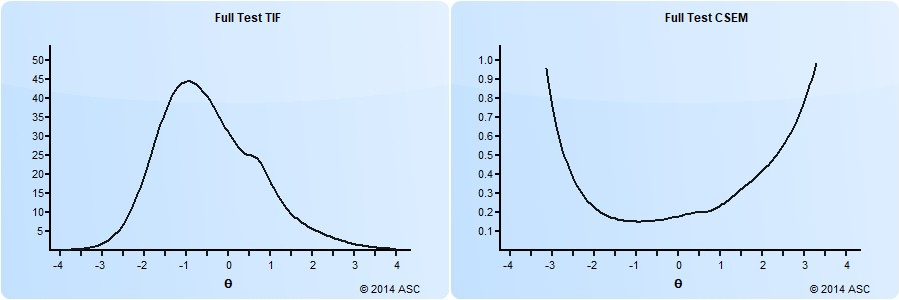
With the contrasting groups approach, candidates are sorted into Pass and Fail groups based on their performance on a different exam or some other unrelated standard.  We can then compare the score distributions on our exam for the two separate groups, and pick a cutscore that best differentiates Pass vs Fail on the other standard.  An example of this is below.  If using data from another exam, a sample of at least 50 candidates is obviously needed, since you are evaluating distributions.

Borderline Group

The Borderline Group method is similar to Contrasting Groups, but a borderline group is defined using alternative information such as biodata, and the scores of the group are evaluated.

Hofstee

The Hofstee approach is often used as a reality check for the modified-Angoff method, but can be done on its own.  It involves only a few estimates from a panel of SMEs.

Ebel

The Ebel approach categorizes items by importance as well as difficulty.  It is very old and not used anymore.

How to choose an approach?

There is often no specifically correct answer.  In fact, guidelines like NCCA do not lay out which method to use, they just tell you to use an appropriate method.

There are several considerations.  Perhaps the most important is whether you have existing data.  The Bookmark, Contrasting Groups, and Borderline Group approaches all assume that we have data from a test already delivered, which we can analyze with the perspective of the latent standard.  The Angoff and Hofstee approaches, in contrast, can be done before a test is ever delivered.  This is arguably less defensible, but is a huge practical advantage.

The choice also depends on whether you can easily recruit a panel of subject matter experts, as that is required for Angoff and Bookmark.  The Contrasting Groups method assumes we have a gold standard, which is rare.

How can I implement a standard setting study?

If your organization has an in-house psychometrician, they can usually do this.  If, for example, you are a board of experts in a profession but lack experience in psychometrics, you need to hire a firm.  We can perform such work for you – contact us to learn more.


school-teacher-teaching-a-class

One of the most cliche phrases associated with assessment is “teaching to the test.”  I’ve always hated this phrase, because it is only used in a derogatory matter, almost always by people who do not understand the basics of assessment and psychometrics.  I recently saw it mentioned in this article on PISA, and that was one time too many, especially since it was used in an oblique, vague, and unreferenced manner.

So, I’m going to come out and say something very unpopular: in most cases, TEACHING TO THE TEST IS A GOOD THING.

Why teaching to the test is usually a good thing

If the test reflects the curriculum – which any good test will – then someone who is teaching to the test will be teaching to the curriculum.  Which, of course, is the entire goal of teaching. The phrase “teaching to the test” is used in an insulting sense, especially because the alliteration is resounding and sellable, but it’s really not a bad thing in most cases.  If a curriculum says that 4th graders should learn how to add and divide fractions, and the test evaluates this, what is the problem? Especially if it uses modern methodology like adaptive testing or tech-enhanced items to make the process more engaging and instructional, rather than oversimplifying to a text-only multiple choice question on paper bubble sheets?

The the world of credentialing assessment, this is an extremely important link.  Credential tests start with a job analysis study, which surveys professionals to determine what they consider to be the most important and frequently used skills in the job.  This data is then transformed into test blueprints. Instructors for the profession, as well as aspiring students that are studying to pass the test, then focus on what is in the blueprints.  This, of course, still contains the skills that are most important and frequently used in the job!

So what is the problem then?

Now, telling teachers how to teach is more concerning, and more likely to be a bad thing.  Finland does well because it gives teachers lots of training and then power to choose how they teach, as noted in the PISA article.

As a counterexample, my high school math department made an edict starting my sophomore year thaborderline method educational assessmentt all teachers had to use the “Chicago Method.” It was pure bunk and based on the fact that students should be doing as much busy work as possible instead of the teachers actually teaching. I think it is because some salesman convinced the department head to make the switch so that they would buy a thousand brand new textbooks.  The method makes some decent points (here’s an article from, coincidentally, when I was a sophomore in high school) but I think we ended up with a bastardization of it, as the edict was primarily:

  1. Assign students to read the next chapter in class (instead of teaching them!); go sit at your desk.
  2. Assign students to do at least 30 homework questions overnight, and come back tomorrow with any questions they have.
  3. Answer any questions, then assign them the next chapter to read.  Whatever you do, DO NOT teach them about the topic before they start doing the homework questions.  Go sit at your desk.

Isn’t that preposterous?  Unsurprisingly, after two years of this, I went from being a leader of the Math Team to someone who explicitly said “I am never taking Math again”.  And indeed, I managed to avoid all math during my senior year of high school and first year of college. Thankfully, I had incredible professors in my years at Luther College, leading to me loving math again, earning a math major, and applying to grad school in psychometrics.  This shows the effect that might happen with “telling teachers how to teach.” Or in this case, specifically – and bizarrely – to NOT teach.

What about all the bad tests out there?

Now, let’s get back to the assumption that a test does reflect a curriculum/blueprints.  There are, most certainly, plenty of cases where an assessment is not designed or built well.  That’s an entirely different problem, and is an entirely valid concern. I have seen a number of these in my career.  This danger why we have international standards on assessments, like AERA/APA/NCME and NCCA.  These provide guidelines on how a test should be build, sort of like how you need to build a house according to building code and not just throwing up some walls and a roof.

ansi accreditation certification exam candidates

For example, there is nothing that is stopping me from identifying a career that has a lot of people looking to gain an edge over one another to get a better job… then buying a textbook, writing 50 questions in my basement, and throwing it up on a nice-looking website to sell as a professional certification.  I might sell it for $395, and if I get just 100 people to sign up, I’ve made $39,500!!!! This violates just about every NCCA guideline, though. If I wanted to get a stamp of approval that my certification was legit – as well as making it legally defensible – I would need to follow the NCCA guidelines.

My point here is that there are definitely bad tests out there, just like there are millions of other bad products in the world.  It’s a matter of caveat emptor. But just because you had some cheap furniture on college that broke right away, doesn’t mean you swear off on all furniture.  You stay away from bad furniture.

There’s also the problem of tests being misused, but again that’s not a problem with the test itself.  Certainly, someone making decisions is uninformed. It could actually be the best test in the world, with 100% precision, but if it is used for an invalid application then it’s still not a good situation.  For example, if you took a very well-made exam for high school graduation and started using it for employment decisions with adults. Psychometricians call this validity – that we have evidence to support the intended use of the test and interpretations of scores.  It is the #1 concern of assessment professionals, so if a test is being misused, it’s probably by someone without a background in assessment.

So where do we go from here?

Put it this way, if an overweight person is trying to become fitter, is success more likely to come from changing diet and exercise habits, or from complaining about their bathroom scale?  Complaining unspecifically about a high school graduation assessment is not going to improve education; let’s change how we educate our children to prepare them for that assessment, and ensure that the assessment reflects the goals of the education.  Nevertheless, of course, we need to invest in making the assessment as sound and fair as we can – which is exactly why I am in this career.

item response theory

Classical test theory is a century-old paradigm for psychometrics – using quantitative and scientific processes to develop and analyze assessments to improve their quality.  (Nobody likes unfair tests!)  The most basic and frequently used item statistic from classical test theory is the P-value.  It is usually called item difficulty but is sometimes called item facility, which can lead to possible confusion.

The P-Value Statistic

The classical P-value is the proportion of examinees that respond correctly to a question, or respond in the “keyed direction” for items where the notion of correct is not relevant (imagine a personality assessment where all questions are Yes/No statements such as “I like to go to parties” … Yes is the keyed direction for an Extraversion scale).  Note that this is NOT the same as the p-value that is used in hypothesis testing from general statistical methods.  This P-value is almost universally agreed upon in terms of calculation.  But some people call it item difficulty and others call it item facility.  Why?

It has to do with the clarity interpretation.  It usually makes sense to think of difficulty as an important aspect of the item.  The P-value presents this, but in a reverse manner.  We usually expect higher values to indicate more of something, right?  But a P-value of 1.00 is high, and it means that there is not much difficulty; everyone gets the item correct, so it is actually no difficulty whatsoever.  A P-value of 0.25 is low, but it means that there is a lot of difficulty; only 25% of examinees are getting it correct, so it has quite a lot of difficulty.

So where does “item facility” come in?

See how the meaning is reversed?  It’s for this reason that some psychometricians prefer to call it item facility or item easiness.  We still use the P-value, but 1.00 means high facility/easiness, and 0.25 means low facility/easiness.  The direction of the semantics fits much better.

Nevertheless, this is a minority of psychometricians.  There’s too much momentum to change an entire field at this point!  It’s similar to the 3 dichotomous IRT parameters (a, b, c); some of you might have noticed that they are actually in the wrong order because the 1-parameter model does not use the parameter, it uses the b. 

At the end of the day, it doesn’t really matter, but it’s another good example of how we all just got used to doing something and it’s now too far down the road to change it.  Tradition is a funny thing.

Test response function 10 items Angoff

Need to set a cutscore on a test with item response theory?  There are ways to do so directly, such as the Bookmark method.  But do you have an existing cutscore on the number-correct scale?  Cutscores set with classical test theory, such as the Angoff, Nedelsky, or Ebel methods, are easy to implement when the test is scored classically.  But if your test is scored with the item response theory (IRT) paradigm, you need to convert your cutscores onto the theta scale.  The easiest way to do that is to reverse-calculate the test response function (TRF) from IRT.  This post will discuss that.

The Test Response Function

The TRF (sometimes called a test characteristic curve) is an important method of characterizing test performance in the IRT paradigm.  The TRF predicts a classical score from an IRT score, as you see below.  Like the item response function and test information function (item response and test information function ), it uses the theta scale as the X-axis.  The Y-axis can be either the number-correct metric or proportion-correct metric.

Test response function 10 items Angoff

In this example, you can see that a theta of -0.4 translates to an estimated number-correct score of approximately 7.  Note that the number-correct metric only makes sense for linear or LOFT exams, where every examinee receives the same number of items.  In the case of CAT exams, only the proportion correct metric makes sense.

Classical cutscore to IRT

So how does this help us with the conversion of a classical cutscore?  Well, we hereby have a way of translating any number-correct score or proportion-correct score.  So any classical cutscore can be reverse-calculated to a theta value.  If your Angoff study (or Beuk) recommends a cutscore of 7 out of 10 points, you can convert that to a theta cutscore of -0.4 as above.  If the recommended cutscore was 8, the theta cutscore would be approximately 0.7.

Because IRT works in a way that it scores examinees on the same scale with any set of items, as long as those items have been part of a linking/equating study.  Therefore, a single study on a set of items can be equated to any other linear test form, LOFT pool, or CAT pool.  This makes it possible to apply the classically-focused Angoff method to IRT-focused programs.

linear-on-the-fly-test

Linear on the fly testing (LOFT) is an approach to assessment delivery that increases test security by limiting item exposure. It tries to balance the advantages of linear testing (e.g., everyone sees the same number of items, which feels fairer) with the advantages of algorithmic exams (e.g., creating a unique test for everyone).

In general, there are two families of test delivery.  Static approaches deliver the same test form or forms to everyone; this is the ubiquitous and traditional “linear” method of testing.  Algorithmic approaches deliver the test to each examinee based on a computer algorithm; this includes LOFT, computerized adaptive testing (CAT), and multistage testing (MST).

What is linear on-the-fly testing?

The purpose of linear on the fly testing is to give every examinee a linear form that is uniquely created for them – but each one is created to be psychometrically equivalent to all others to ensure fairness.  For example, we might have a pool of 200 items, and every person only gets 100, but that 100 is balanced for each person.  This can be done by ensuring content and/or statistical equivalency, as well ancillary metadata such as item types or cognitive level.

Content Equivalence

This portion is relatively straightforward.  If your test blueprint calls for 20 items in each of 5 domains, for a total of 100 items, then each form administered to examinees should follow this blueprint.  Sometimes the content blueprint might go 2 or even 3 levels deep.

Statistical Equivalence

There are, of course, two predominant psychometric paradigms: classical test theory (CTT) and item response theory (IRT).  With CTT, forms can easily be built to have an equivalent P value, and therefore expected mean score.  If point-biserial statistics are available for each item, you can also design the algorithm to design forms that have the same standard deviation and reliability.

With item response theory, the typical approach is to design forms to have the same test information function, or inversely, conditional standard error of measurement function.  To learn more about how these are implemented, read this blog post about IRT or download our Classical Form Assembly Tool.

Implementing LOFT

LOFT is typically implemented by publishing a pool of items with an algorithm to select subsets that meet the requirements.  Therefore, you need a psychometrically sophisticated testing engine that stores the necessary statistics and item metadata, lets you define a pool of items, specify the relevant options such as target statistics and blueprints, and deliver the test in a secure manner.  Very few testing platforms can implement a quality LOFT assessment.  ASC’s platform does; click here to request a demo.

Why all this?

It certainly is not easy to build a strong item bank, design LOFT pools, and develop a complex algorithm that meets the content and statistical balancing needs.  So why would an organization use linear on the fly testing?

Well, it is much more secure than having a few linear forms.  Since everyone receives a unique form, it is impossible for words to get out about what the first questions on the test are.  And of course, we could simply perform a random selection of 100 items from a pool of 200, but that would be potentially unfair.  Using LOFT will ensure the test remains fair and defensible.

Have you heard about standard setting approaches such as the Hofstee method, or perhaps the Angoff, Ebel, Nedelsky, or Bookmark methods?  There are certainly various ways to set a defensible cutscore or a professional credentialing or pre-employment test.  Today, we are going to discuss the Hofstee method.

Why Standard Setting?

Certification organizations that care about the quality of their examinations need to follow best practices and international standards for test development, such as the Standards laid out by the National Commission for Certifying Agencies (NCCA).  One component of that is standard setting, also known as cutscore studies.  One of the most common and respected approaches for that is the modified-Angoff methodology.

However, the Angoff approach has one flaw: the subject matter experts (SMEs) tend to expect too much out of minimally competent candidates, and sometimes set a cutscore so high that even they themselves would not pass the exam.  There are several reasons this can occur.  For example, raters might think “I would expect anyone that worked for me to know how to do this” and not consider the fact that people who work for them might have 10 years of experience while test candidates could be fresh out of training/school and have the topic only touched on for 5 minutes.  SMEs often forget what it was like to be a much younger and inexperienced version of themselves.

For this reason, several compromise methods have been suggested to compare the Angoff-recommended cutscore with a “reality check” of actual score performance on the exam, allowing the SMEs to make a more informed decision when setting the official cutscore of the exam.  I like to use the Beuk method and the Hofstee method.

The Hofstee Method

One method of adjusting the cutscore based on raters’ impressions of the difficulty of the test and possible pass rates is the Hofstee method (Mills & Melican, 1987; Cizek, 2006; Burr et al., 2016).  This method requires the raters to estimate four values:

  1. The minimum acceptable failure rate
  2. The maximum acceptable failure rate
  3. The minimum cutscore, even if all examinees failed
  4. The maximum cutscore, even if all examinees passed

The first two values are failure rates, and are therefore between 0% and 100%, with 100% indicating a test that is too difficult for anyone to pass.  The latter two values are on the raw score scale, and therefore range between 0 and the number of items in the test, again with a higher value indicating a more difficult cutscore to achieve.

These values are paired, and the line that passes through the two points estimated.  The intersection of this line with the failure rate function, is the recommendation of the adjusted cutscore.   

hofstee

How can I use the Hofstee Method?

Unlike the Beuk, the Hofstee method does not utilize the Angoff ratings, so it represents a completely independent reality check.  In fact, it is sometimes used as a standalone cutscore setting method itself, but because it does not involve rating of every single item, I recommend it be used in concert with the Angoff and Beuk approaches.


Spearman-Brown


The Spearman-Brown formula, also known as the Spearman-Brown Prophecy Formula or Correction, is a method used in evaluating test reliability.  It is based on the idea that split-half reliability has better assumptions than coefficient alpha but only estimates reliability for a half-length test, so you need to implement a correction that steps it up to a true estimate for a full-length test.

Looking for software to help you analyze reliability?  Download a free copy of Iteman.


Coefficient Alpha vs. Split Half

The most commonly used index of test score reliability is coefficient alpha.  However, it’s not the only index on internal consistency.  Another common approach is split-half reliability, where you split the test into two halves (first/last, even/odd, or random split) and then correlate scores on each.  The reasoning is that if both halves of the test measure the same construct at a similar level of precision and difficulty, then scores on one half should correlate highly with scores on the other half.  More information on split-half is found here.

However, split-half reliability provides an inconvenient situation: we are effectively gauging the reliability of half a test.  It is a well-known fact that reliability is increased by more items (observations); we can all agree that a 100-item test is more reliable than a 10 item test comprised of similar quality items.  So the split half correlation is blatantly underestimating the reliability of the full-length test.

The Spearman-Brown Formula

To adjust for this, psychometricians use the Spearman-Brown prophecy formula.  It takes the split half correlation as input and converts it to an estimate of the equivalent level of reliability for the full-length test.  While this might sound complex, the actual formula is quite simple.

Spearman-Brown

As you can see, the formula takes the split half reliability (rhalf) as input and produces the full-length estimation (rfull) .  This can then be interpreted alongside the ubiquitously used coefficient alpha.

While the calculation is quite simple, you still shouldn’t have to do it yourself.  Any decent software for classical item analysis will produce it for you.  As an example, here is the output of the Reliability Analysis table from our Iteman software for automated reporting and assessment intelligence with CTT.  This lists the various split-half estimates alongside the coefficient alpha (and its associated SEM) for the total score as well as the domains, so you can evaluate if there are domains that are producing unusually unreliable scores. 

Note: There is an ongoing argument amongst psychometricians whether domain scores are even worthwhile since the assumed unidimensionality of most tests means that the domain scores are  less reliable estimates of the total score, but that’s a whole ‘another blog post!

Score N Items Alpha SEM Split-Half (Random) Split-Half (First-Last) Split-Half (Odd-Even) S-B Random S-B First-Last S-B Odd-Even
All items 50 0.805 3.058 0.660 0.537 0.668 0.795 0.699 0.801
1 10 0.522 1.269 0.338 0.376 0.370 0.506 0.547 0.540
2 18 0.602 1.860 0.418 0.309 0.448 0.590 0.472 0.619
3 12 0.605 1.496 0.449 0.417 0.383 0.620 0.588 0.553
4 10 0.485 1.375 0.300 0.329 0.297 0.461 0.495 0.457

You can see that, as mentioned earlier, there are 3 ways to do the split in the first place, and Iteman reports all three.  It then reports the Spearman-Brown formula for each.  These generally align with the results of the alpha estimates, which overall provide a cohesive picture about the structure of the exam and its reliability of scores.  As you might expect, domains with more items are slightly more reliable, but not super reliable since they are all less than 20 items.

So, what does this mean in the big scheme of things?  Well, in many cases the Spearman-Brown estimates might not differ from the alpha estimates, but it’s still good to know that they do.  In the case of high-stakes tests, you want to go through every effort you can to ensure that the scores are highly reliable and precise.

Tell me more!

If you’d like to learn more, here is an article on the topic.  Or, contact solutions@assess.com to discuss consulting projects with our Ph.D. psychometricians.

Artificial intelligence (AI) and machine learning (ML) have become buzzwords over the past few years.  As I already wrote about, they are actually old news in the field of psychometrics.   Factor analysis is a classical example of ML, and item response theory also qualifies as ML.  Computerized adaptive testing is actually an application of AI to psychometrics that dates back to the 1970s.

One thing that is very different about the world of AI/ML today is the massive power available in free platforms like R, Python, and TensorFlow.  I’ve been thinking a lot over the past few years about how these tools can impact the world of assessment.  A straightforward application is too automated essay scoring; a common way to approach that problem is through natural language processing with the “bag of words” model and utilize the document-term matrix (DTM) as predictors in a model for essay score as a criterion variable.  Surprisingly simple.  This got me to wondering where else we could apply that sort of modeling.  Obviously, student response data on selected-response items provides a ton of data, but the research questions are less clear.  So, I turned to the topic that I think has the next largest set of data and text: item banks.

Step 1: Text Mining

The first step was to explore tools for text mining in R.  I found this well-written and clear tutorial on the text2vec package and used that as my springboard.  Within minutes I was able to get a document term matrix, and in a few more minutes was able to prune it.  This DTM alone can provide useful info to an organization on their item bank, but I wanted to delve further.  Can the DTM predict item quality?

Step 2: Fit Models

To do this, I utilized both the caret and glmnet packages to fit models.  I love the caret package, but if you search the literature you’ll find it has a problem with sparse matrices, which is exactly what the DTM is.  One blog post I found said that anyone with a sparse matrix is pretty much stuck using glmnet.

I tried a few models on a small item bank of 500 items from a friend of mine, and my adjusted R squared for the prediction of IRT parameters (as an index of item quality) was 0.53 – meaning that I could account for more than half the variance of item quality just by knowing some of the common words in each item’s stem.  I wasn’t even using the answer texts n-grams, or additional information like Author and content domain.

Want to learn more about your item banks?

I’d love to swim even deeper on this issue.  If you have a large item bank and would like to work with me to analyze it so you can provide better feedback and direction to your item writers and test developers, drop me a message at solutions@assess.com!  This could directly impact the efficiency of your organization and the quality of your assessments.

So, yeah, the use of “hacks” in the title is definitely on the ironic and gratuitous side, but there is still a point to be made: are you making full use of current technology to keep your tests secure?  Gone are the days when you are limited to linear test forms on paper in physical locations.  Here are some quick points on how modern assessment technology can deliver assessments more securely, effectively, and efficiently than traditional methods:

1.  AI delivery like CAT and LOFT

Psychometrics was one of the first areas to apply modern data science and machine learning (see this blog post for a story about a MOOC course).  But did you know it was also one of the first areas to apply artificial intelligence (AI)?  Early forms of computerized adaptive testing (CAT) were suggested in the 1960s and had become widely available in the 1980s.  CAT delivers a unique test to each examinee by using complex algorithms to personalize the test.  This makes it much more secure, and can also reduce test length by 50-90%.

2. Psychometric forensics

Modern psychometrics has suggested many methods for finding cheaters and other invalid test-taking behavior.  These can range from very simple rules like flagging someone for having a top 5% score in a bottom 5% time, to extremely complex collusion indices.  These approaches are designed explicitly to keep your test more secure.

3. Tech enhanced items

Tech enhanced items (TEIs) are test questions that leverage technology to be more complex than is possible on paper tests.  Classic examples include drag and drop or hotspot items.  These items are harder to memorize and therefore contribute to security.

4. IP address limits

Suppose you want to make sure that your test is only delivered in certain school buildings, campuses, or other geographic locations.  You can build a test delivery platform that limits your tests to a range of IP addresses, which implements this geographic restriction.

5. Lockdown browser

A lockdown browser is a special software that locks a computer screen onto a test in progress, so for example a student cannot open Google in another tab and simply search for answers.  Advanced versions can also scan the computer for software that is considered a threat, like a screen capture software.

6. Identity verification

Tests can be built to require unique login procedures, such as requiring a proctor to enter their employee ID and the test-taker to enter their student ID.  Examinees can also be required to show photo ID, and of course, there are new biometric methods being developed.

7. Remote proctoring

The days are gone when you need to hop in the car and drive 3 hours to sit in a windowless room at a community college to take a test.  Nowadays, proctors can watch you and your desktop via webcam.  This is arguably as secure as in-person proctoring, and certainly more convenient and cost-effective.

So, how can I implement these to deliver assessments more securely?

Some of these approaches are provided by vendors specifically dedicated to that space, such as ProctorExam for remote proctoring.  However, if you use ASC’s FastTest platform, all of these methods are available for you right out of the box.  Want to see for yourself?  Sign up for a free account!

three standard errors

One of my graduate school mentors once said in class that there are three standard errors that everyone in the assessment or I/O Psych field needs to know: mean, error, and estimate.  They are quite distinct in concept and application but easily confused by someone with minimal training.

I’ve personally seen the standard error of the mean reported as the standard error of measurement, which is completely unacceptable.

So in this post, I’ll briefly describe each so that the differences are clear.  In later posts, I’ll delve deeper into each of the standard errors.

Standard Error of the Mean

This is the standard error that you learned about in Introduction to Statistics back in your sophomore year of college/university.  It is related to the Central Limit Theorem, the cornerstone of statistics.  Its purpose is to provide an index of accuracy (or conversely, error) in a sample mean.  Any sample drawn from a population will have an average, but these can vary.  The standard error of the mean estimates the variation we might expect in these different means from different samples and is defined as

   SEmean = SD/sqrt(n)

Where SD is the sample’s standard deviation and n is the number of observations in the sample.  This can be used to create a confidence interval for the true population mean.

The most important thing to note, with respect to psychometrics, is that this has nothing to do with psychometrics.  This is just general statistics.  You could be weighing a bunch of hay bales and calculating their average; anything where you are making observations.  It can be used, however, with assessment data.

For example, if you do not want to make every student in a country take a test, and instead sample 50,000 students, with a mean of 71 items correct with an SD of 12.3, then the SEM is  12.3/sqrt(50000) = 0.055.  You can be 95% certain that the true population means then lies in the narrow range of 71 +- 0.055.

Click here to read more.

Standard Error of Measurement

More important in the world of assessment is the standard error of measurement.  Its purpose is to provide an index of the accuracy of a person’s score on a test.  That is a single person, rather than a group like with the standard error of the mean.  It can be used in both the classical test theory perspective and item response theory perspective, though it is defined quite differently in both.

In classical test theory, it is defined as

   SEM = SD*sqrt(1-r)

Where SD is the standard deviation of scores for everyone who took the test, and r is the reliability of the test.  It can be interpreted as the standard deviation of scores that you would find if you had the person take the test over and over, with a fresh mind each time.  A confidence interval with this is then interpreted as the band where you would expect the person’s true score on the test to fall.

Item Response Theory conceptualizes the SEM as a continuous function across the range of student abilities.  A test form will have more accuracy – less error – in a range of abilities where there are more items or items of higher quality.  That is, a test with most items of middle difficulty will produce accurate scores in the middle of the range, but not measure students on the top or bottom very well.  The example below is a test that has many items above the average examinee score (θ) of 0.0 so that any examinee with a score of less than 0.0 has a relatively inaccurate score, namely with an SEM greater than 0.50.

Standard error of measurement and test information function


For a deeper discussion of SEM, click here. 

Standard Error of the Estimate

Lastly, we have the standard error of the estimate.  This is an estimate of the accuracy of a prediction that is made, usually in the paradigm of linear regression.  Suppose we are using scores on a 40 item job knowledge test to predict job performance, and we have data on a sample of 1,000 job incumbents that took the test last year and have job performance ratings from this year on a measure that entails 20 items scored on a 5 point scale for a total of 100 points.

There might have been 86 incumbents that scored 30/40 on the test, and they will have a range of job performance, let’s say from 61 to 89.  If a new person takes the test and scores 30/40, how would we predict their job performance?

The SEE is defined as

       SEE = SDy*sqrt(1-r2)

Here, the r is the correlation of x and y, not reliability. Many statistical packages can estimate linear regression, SEE, and many other related statistics for you.  In fact, Microsoft Excel comes with a free package to implement simple linear regression.  Excel estimates the SEE as 4.69 in the example above, and the regression slope and intercept are 29.93 and 1.76, respectively

Given this, we can estimate the job performance of a person with a 30 test score to be 82.73.  A 95% confidence interval for a candidate with a test score of 30 is then 82.71-(4.69*1.96) to 82.71+(4.69*1.96), or 73.52 to 91.90.

You can see how this might be useful in prediction situations.  Suppose we wanted to be sure that we only hired people who are likely to have a job performance rating of 80 or better?  Well, a cutscore of 30 on the test is therefore quite feasible.

OK, so now what?

Well, remember that these three standard errors are quite different and are not even in related situations.  When you see a standard error requested – for example if you must report the standard error for an assessment – make sure you use the right one!