
“Dichotomous” Vs “Polytomous” in IRT?
What is the difference between the terms dichotomous and polytomous in psychometrics? Well, these terms represent two subcategories within item response theory. Item response theory (IRT) is the dominant psychometric paradigm for constructing, scoring and analyzing assessments. Virtually all large-scale assessments utilize IRT because of its well-documented advantages. In many cases, however, it is referred to as a single way of analyzing data. But, IRT is actually a family of fast-growing models. The models operate quite differently based on whether the test questions are scored right/wrong or yes/no (dichotomous), vs. complex items like an essay that might be scored on a rubric of 0 to 6 points (polytomous). This post will provide a description of the differences and when to use one or the other.
Ready to use IRT? Download Xcalibre for free.
Dichotomous IRT Models
Dichotomous IRT models are those with two possible item scores. Note that I say “item scores” and not “item responses” – the most common example of a dichotomous item is multiple choice, which typically has 4 to 5 options, but only two possible scores (correct/incorrect).
True/False or Yes/No items are also obvious examples and are more likely to appear in surveys or inventories, as opposed to the ubiquity of the multiple-choice item in achievement/aptitude testing. Other item types that can be dichotomous are Scored Short Answer and Multiple Response (all or nothing scoring).
What models are dichotomous?
The three most common dichotomous models are the 1PL/Rasch, the 2PL, and the 3PL. Which one to use depends on the type of data you have, as well as your doctrine of course. A great example is Scored Short Answer items: there should be no effect of guessing on such an item, so the 2PL is a logical choice. Here is a broad overgeneralization:
- 1PL/Rasch: Uses only the difficulty (b) parameter and does not take into account guessing effects or the possibility that some items might be more discriminating than others; however, can be useful with small samples and other situations
- 2PL: Uses difficulty (b) and discrimination (a) parameters, but no guessing (c); relevant for the many types of assessment where there is no guessing
- 3PL: Uses all three parameters, typically relevant for achievement/aptitude testing.
What do dichotomous models look like?
Dichotomous models, graphically, will have one S-shaped curve with a positive slope, as seen here. This model that the probability of responding in the keyed direction increases with higher levels of the trait or ability.
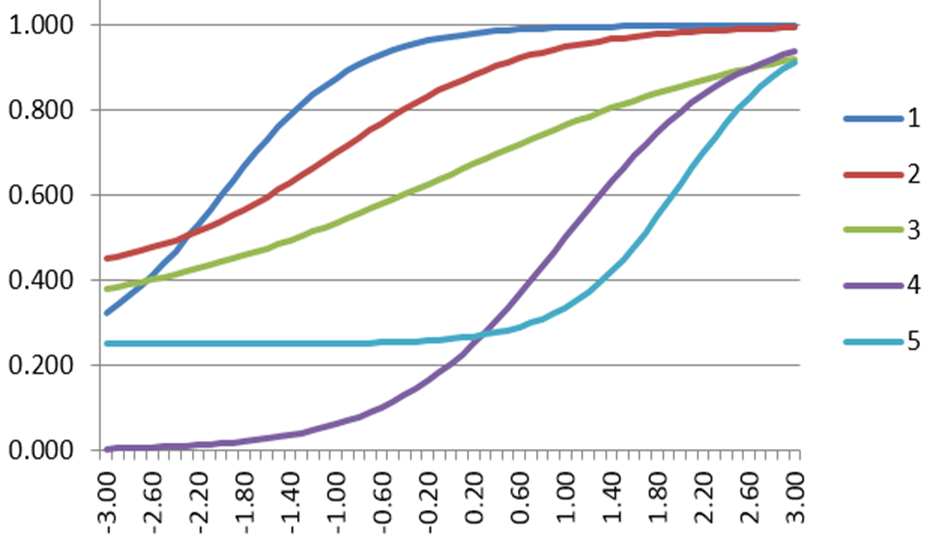
Technically, there is also a line for the probability of an incorrect response, which goes down, but this is obviously the 1-P complement, so it is rarely drawn in graphs. It is, however, used in scoring algorithms (check out this white paper).
In the example, a student with theta = -3 has about a 0.28 chance of responding correctly, while theta = 0 has about 0.60 and theta = 1 has about 0.90.
Polytomous IRT Models
Polytomous models are for items that have more than two possible scores. The most common examples are Likert-type items (Rate on a scale of 1 to 5) and partial credit items (score on an Essay might be 0 to 5 points). IRT models typically assume that the item scores are integers.
What models are polytomous?
Unsurprisingly, the most common polytomous models use names like rating scale and partial credit.
- Rating Scale Model (Andrich, 1978)
- Partial Credit Model (Masters, 1982)
- Generalized Rating Scale Model (Muraki, 1990)
- Generalized Partial Credit Model (Muraki, 1992)
- Graded Response Model (Samejima, 1972)
- Nominal Response Model (Bock, 1972)
What do polytomous models look like?
Polytomous models have a line that dictates each possible response. The line for the highest point value is typically S-shaped like a dichotomous curve. The line for the lowest point value is typically sloped down like the 1-P dichotomous curve. Point values in the middle typically have a bell-shaped curve. The example is for an Essay that scored 0 to 5 points. Only students with theta >2 are likely to get the full points (blue), while students 1<theta<2 are likely to receive 4 points (green).
I’ve seen “polychotomous.” What does that mean?
It means the same as polytomous.
How is IRT used in our platform?
We use it to support the test development cycle, including form assembly, scoring, and adaptive testing. You can learn more on this page.
How can I analyze my tests with IRT?
You need specially designed software, like Xcalibre. Classical test theory is so simple that you can do it with Excel functions.
Recommended Readings
Item Response Theory for Psychologists by Embretson and Riese (2000).
Nathan Thompson, PhD
Latest posts by Nathan Thompson, PhD (see all)
- What is a T score? - April 15, 2024
- Item Review Workflow for Exam Development - April 8, 2024
- Likert Scale Items - February 9, 2024